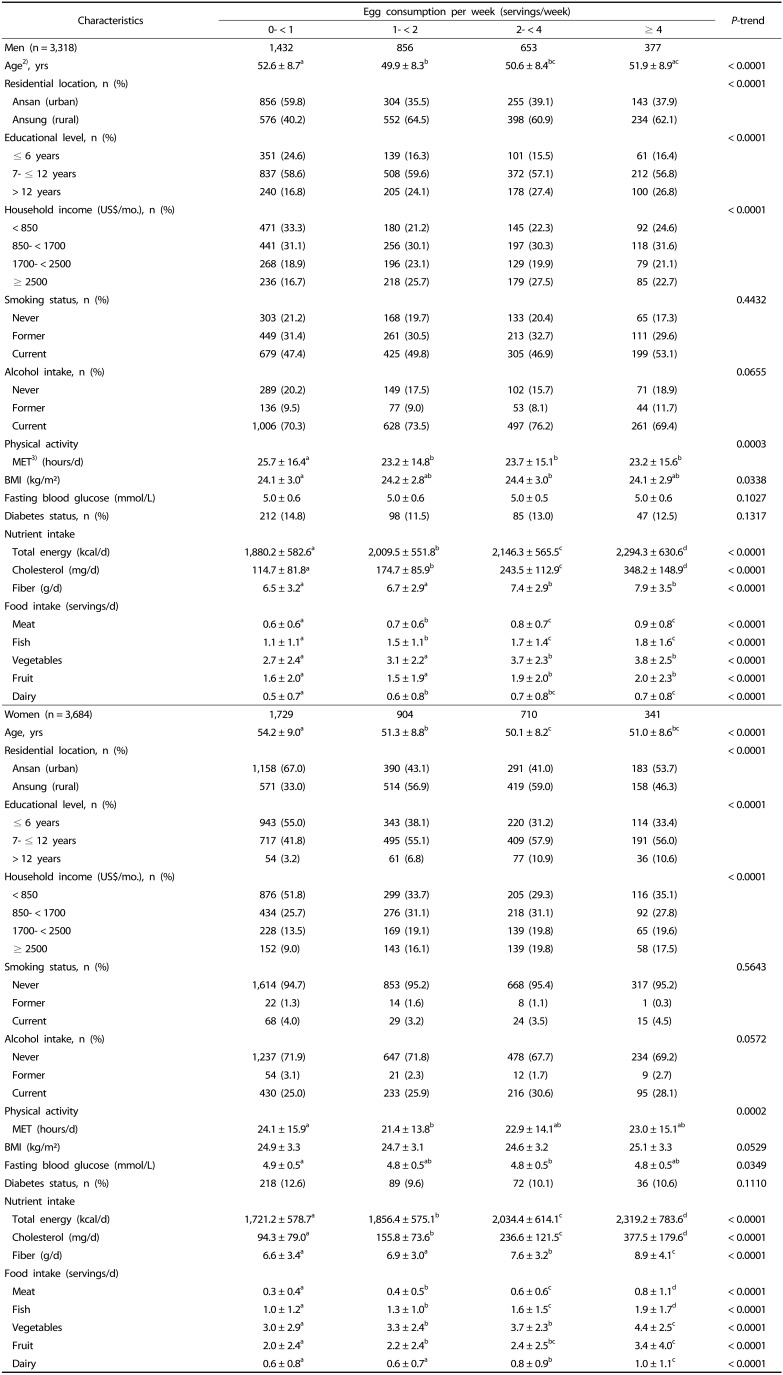
Table 1. Baseline characteristics of participants according to egg consumption (n = 7,002)1).
1) Data were missing for the following variables: educational level, n = 38; household income, n = 103; smoking status, n = 58; alcohol intake, n = 23; body mass index, n = 4.
2) Values are means ± SD or numbers (percentages).
3) MET: metabolic equivalent of task
a,b,c,d Difference in variables among categories were evaluated by a generalized linear model (Tukey's test of multiple comparisons).

