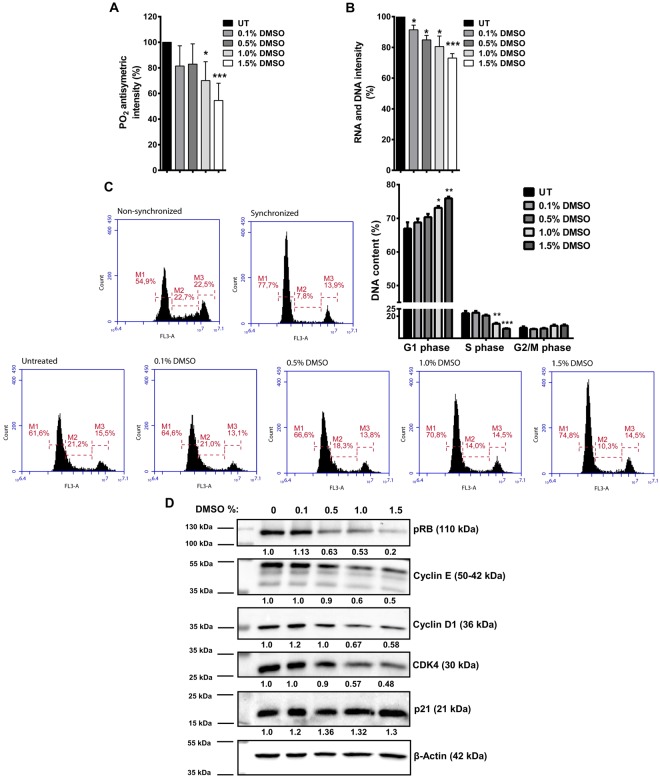
Figure 3.
DMSO treatment alters cellular nucleic acid content in HCT-116 cells. (A) PO2 antisymmetric band intensity (%) values, and (B) Ribose ring vibrations band intensity (%) values for DMSO treated and untreated (UT) HCT-116 cells are shown. The results are given as mean ± SEM. t test was used to compare DMSO treated cells with UT cells. (C) HCT-116 cells were synchronized by serum starvation for 24 h. Following starvation, cells were treated with serum containing medium in the presence or absence (untreated-UT) of DMSO for 7 h. Representative histograms for cell cycle phase distributions of DMSO treated and untreated cells after release, and non-starved (non-synchronized) and starved (synchronized) cells are given. Percentages of cell cycle phases are given as mean ± SEM of three independent biological replicates each with two technical replicates. Statistical significance was calculated with respect to UT cells by using t test. (D) After 7 h release following 24 h starvation, expression levels of cell cycle proteins associated with G1 to S phase transition were examined in DMSO treated or untreated cells by western blot. β-Actin was used as loading control for normalization. Changes in the expression levels are given as fold change with respect to untreated cells.

