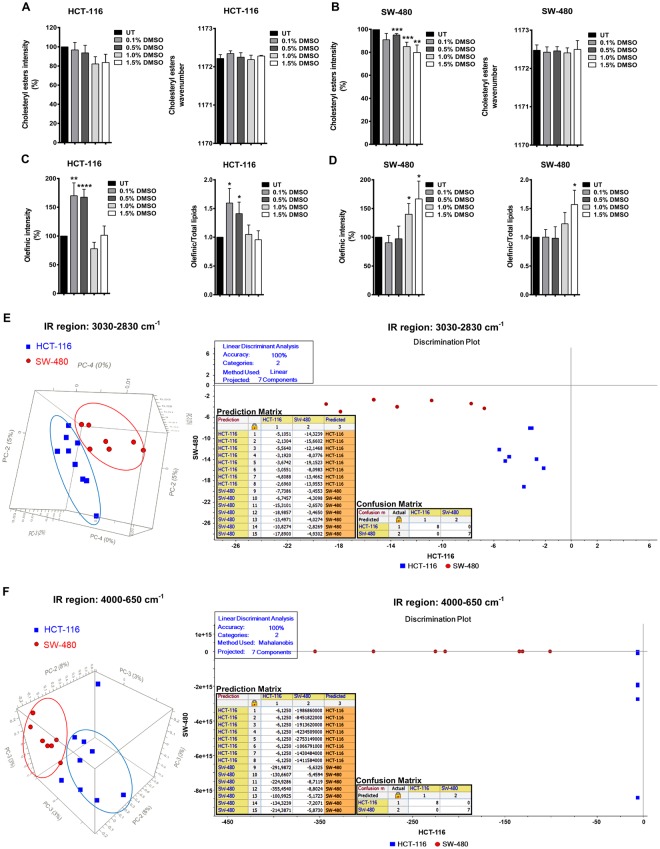
Figure 7.
DMSO treatment influences cellular lipid content and status in HCT-116 and SW-480 cells. (A) The band intensities (%) and wavenumber values of cholesteryl esters in DMSO treated and untreated (UT) HCT-116 and, (B) in SW-480 cells. (C) The intensities (%) of olefinic and olefinic/total lipids bands in DMSO treated and UT HCT-116 and, (D) SW-480 cells. The results are represented as mean ± SEM. t test was used to compare the results with respect to untreated cells. (E) Left Panel: PCA 3D scores plots for HCT-116 and SW-480 cells in 3030–2830 cm−1 and 4000–650 cm−1 spectral regions. Right Panel: LDA discrimination plots, and prediction and confusion matrices for HCT-116 and SW-480 cells in 3030–2830 cm−1 and 4000–650 cm−1 spectral regions.

