Figure 5.
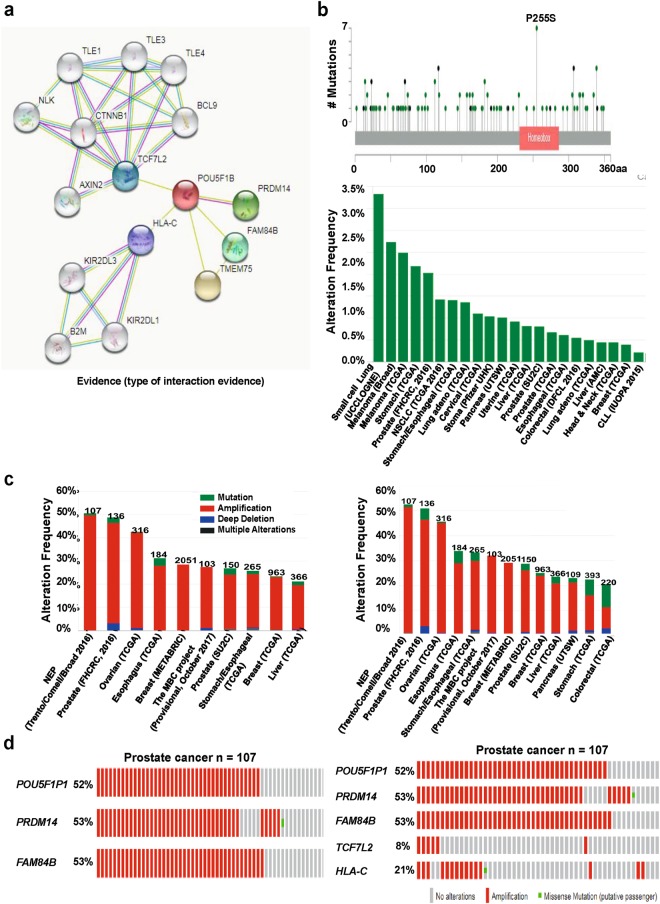
Mutation and alteration frequency patterns of POU5F1P1 and its associated genes in various cancers. (a) Functional protein partner of POU5F1P1 was predicted by STRING web. Line indicates the type of interaction evidence. (b) Mutation diagram of POU5F1P1 in different cancer types across protein domains was expressed. POU5F1P1 mutation frequencies are the highest in lung and one hot spots (P255S) representing the common founder mutations in POU5F1P1 homeobox site. The alteration frequency of a three-gene signature (POU5F1P1, PRDM14, and FAM84B) was determined using cBioPortal and is shown on the top. (c) The alteration frequency of a five-gene signature (POU5F1P1, PRDM14, FAM84B, TCFL2, and HLA-C) was determined using cBioPortal and is shown on the bottom. Only cancer types containing >100 samples and an alteration frequency of >20% are shown. The alteration frequency included deletions (blue), amplification (red), multiple alterations (grey), or mutation (green). The total number of samples for each cancer type is indicated by the numbers at the top of each column. Prostate cancer types frequently amplify POU5F1P1. We used the Oncoprint feature of cBioPortal to determine the copy number alteration frequency of each gene in POU5F1 within selected cancer subtypes. (d) The percentages of alterations in three genes and five genes in the prostate cancer. Grey bars along a vertical line represent the same sample evaluated for amplification (red), deep deletion (blue), missense mutation (green), truncating mutation (black), or in-frame mutation (brown).

