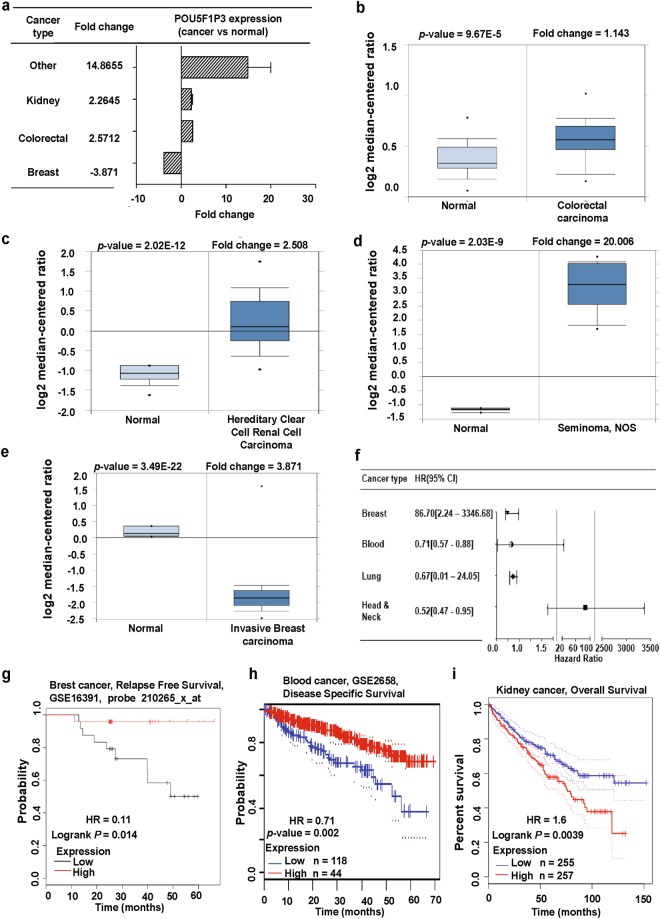
Figure 6.
POU5F1P3 expression pattern and patient survival analysis in different cancer types compared to POU5F1P3 expression in normal tissue and each cancer tissue. (a) The fold-change of POU5F1P3 in various types of cancers was identified from our analyses shown in Supplementary Table S13 and expressed as the forest plot. (b–e) The box plot comparing specific POU5F1P3 expression in normal (left plot) and cancer tissue (right plot) was derived from the Oncomine database. The analysis was shown in colorectal carcinoma relative to normal colorectal (b), in renal carcinoma relative to normal renal (c), in seminoma relative to normal testicle (d), in breast carcinoma relative to normal breast (e). (f) Significant hazard ratios in various types of cancers was identified from our analyses shown in Table S14 and expressed as a forest plot. (g–i) The survival curve comparing patients with high (red) and low (black, blue) expression in breast (g), blood (h), and kidney (i) cancers was plotted from the Kaplan Meier-plotter, PrognoScan, and GAPIA database. The survival curve was analyzed using a threshold Cox p-value < 0.05.

