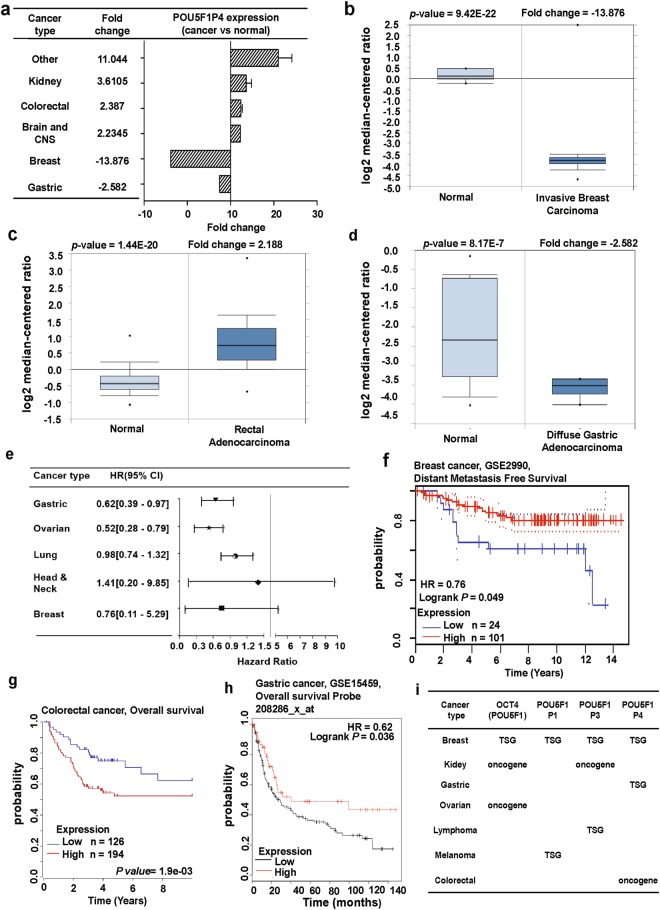
Figure 7.
POU5F1P4 expression pattern and patient survival analysis in different cancer types compared to POU5F1P4 expression in normal tissue and each cancer tissue: (a) The fold-change of POU5F1P4 in various types of cancers was identified from our analyses shown in Supplementary Table S15 and expressed as the forest plot. (b–d) The box plot comparing specific POU5F1P4 expression in normal (left plot) and cancer tissue (right plot) was derived from the Oncomine database. The analysis was shown in breast carcinoma relative to normal breast (b), in rectal adenocarcinoma relative to normal rectal tissue (c), in gastric adenocarcinoma relative to normal gastric tissue (d). (e) Significant hazard ratios in various types of cancers were identified from our analyses shown in Supplementary Table S16 and expressed as the forest plot. (f–h) The survival curve comparing patients with high (red) and low (black, blue) expression in breast (f), colorectal (g), and gastric (h) tissue was plotted from the PrognoScan database, R2: Genomics analysis and visualization platform, and Kaplan-Meier plotter. The survival curve was analyzed with a threshold Cox p-value < 0.05. (i) The summary of predictive role of OCT4 (POU5F1) and its three pseudogenes in different cancers is based on the consistent results of gene expression and outcome.

