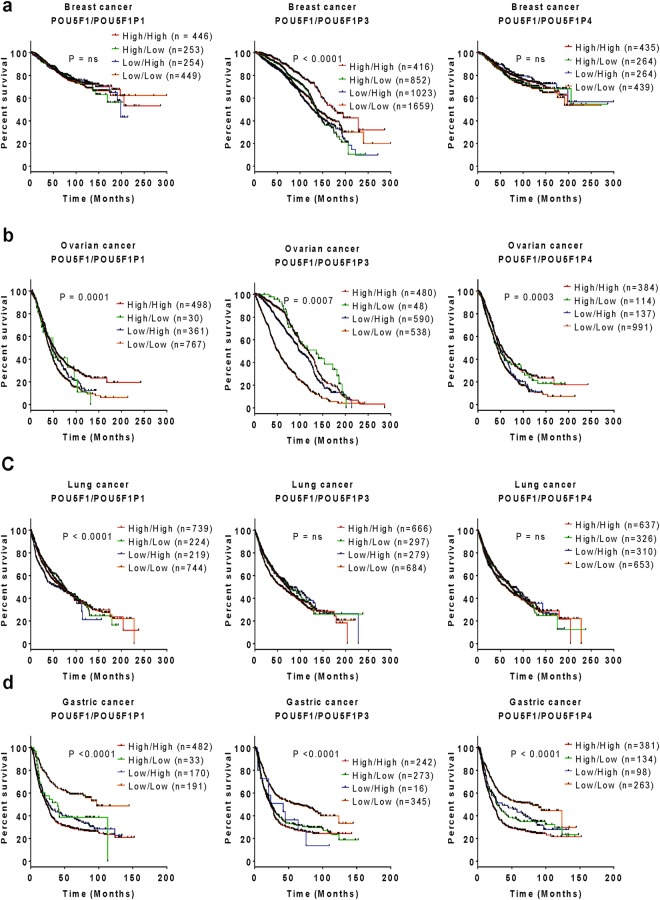
Figure 8.
Expression co-occurrence of OCT4 and its pseudogenes in relation to the clinical prognosis of cancer patients. The multivariate survival curves compare the clinical prognosis in patients with high/high (red), high/low (green), low/high (blue), and low/low (orange) expression co-occurrence of POU5F1/POU5F1P1, POU5F1/POU5F1P3, and POU5F1/POU5F1P4 in breast (a), ovarian (b), lung (c), and gastric (d) cancers. The clinical outcome data were retrieved from the Kaplan-Meier plotter database. Information indicating statistical significance represents p < 0.05, and a non-significant p-value is expressed as ‘ns’ in the graph.

