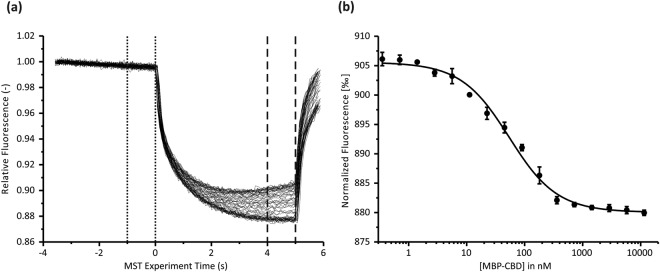
Figure 4.
CHP3 binds with high affinity to the CBD region of NHE1 as probed in vitro by microscale thermophoresis. (a) Representative MST data for CHP3:MBP-CBD interaction showing superimposed time traces of five independent titration series for one biological replicate. The fluorescence was normalized to a starting value of 1. The laser was switched off after 5 s and the thermophoresis + T-jump signals were used for data analysis. Time spans for Fc and Fh are indicated with dotted and dashed lines, respectively. (b) MST binding curve derived from (a) as described in Materials and Methods. The line shows the best fit using the bimolecular binding model. The data for three biological replicates are summarized in Table 1. A mean KD = 55.5 ± 6.8 nM (mean ± standard deviation (SD)) was determined.

