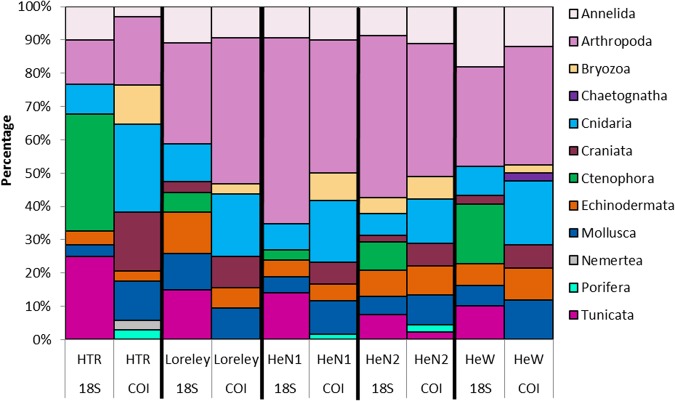
Figure 6.
Locations of fall sampling around Helgoland. Prepared by ArcMap 10.4.1 (www.esri.de). Stacked bar plot represent 18S rDNA numbers of sequences and COI numbers of species per phylum at the stations sampled at autumn. Following abbreviations indicate stations: HTR, “Helgoländer Tiefe Rinne”; Loreley, Loreley Bank; HeN1 Helgoland North 01; HeN2, Helgoland North 02; HeW, Helgoland West. Prepared by Babett Günther using Microsoft Excel 2010 (www.microsoft.com).

