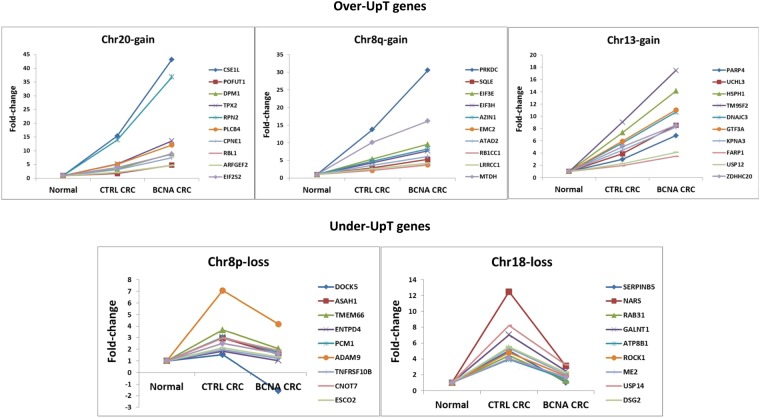
Figure 8.
Fold changes of ten representative “Over-UpT” and “Under-UpT” genes. Over-UpT genes located in Chr20, Chr8q and Chr13 and Under-UpT genes located in Chr8p and Chr18. Ten representative genes for chromosome are shown. The plots show transcript levels in Normal Colonic Tissue (Normal), in Control (CTRL) CRC group and in selected CRC group (BCNA CRC). Transcript levels are expressed as fold-change relative to values in normal tissue (FC3 or FC4). A complete list of Over-UpT genes and their full names is reported in Supplementary Table S3. A complete list of Under-UpT genes and their full names is reported in Supplementary Table S4.

