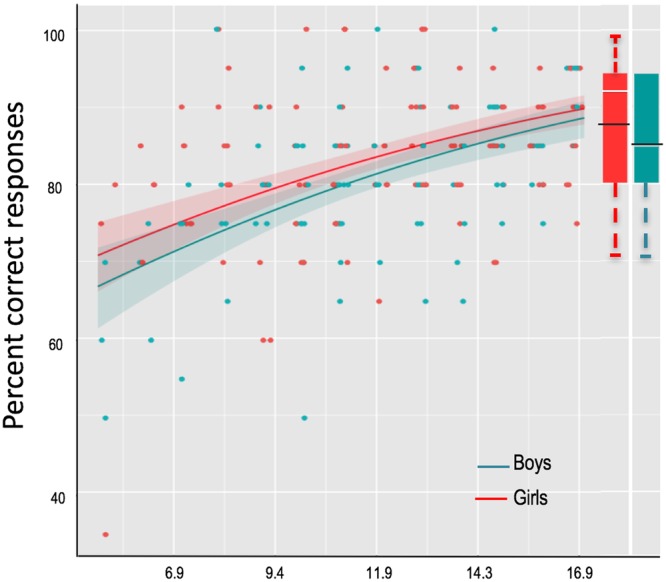
Figure 1.

Proportion of correct responses as a function of age for boys and girls. Each dot represents the performance of one participant. The graph is centered on the mean age of the developmental sample (11.8 years) The lines represent the predicted performances as a function of age for males and females separately for the model: Response ~age + age2 + 1|Subject (from the function sjp.glmer; Lüdecke D (2017). sjPlot: Data Visualization for Statistics in Social Science. R package version 2.4.0, https://CRAN.R-project.org/package=sjPlot). Shaded areas represent confidence intervals. Boxplots represent median and 75 percentile in adults’ data; the black lines represent the mean performance of adults.
