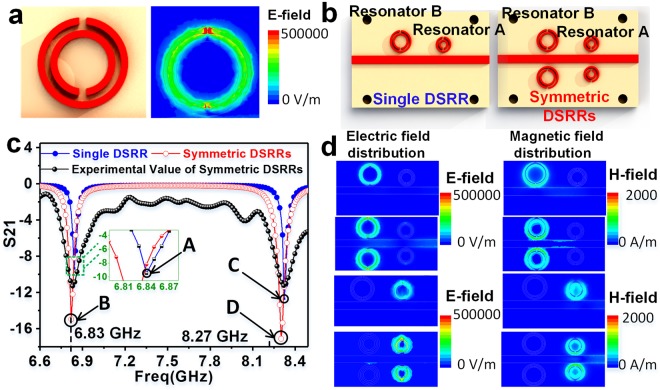
Figure 3.
Simulation results of the sensor with various DSRRs. (a) The electric field distribution of DSRR. (b) Schematic diagram of sensors with single DSRR or symmetrical DSRRs. (c) The simulated and experimental S21 spectrum of single or symmetric DSRRs. Point A and B represent resonances excited by single and dual resonator B, respectively. Point C and D represent resonances excited by single and dual resonator A, respectively. (d) Electric and magnetic field distribution for the Point A, B, C and D in (c).

