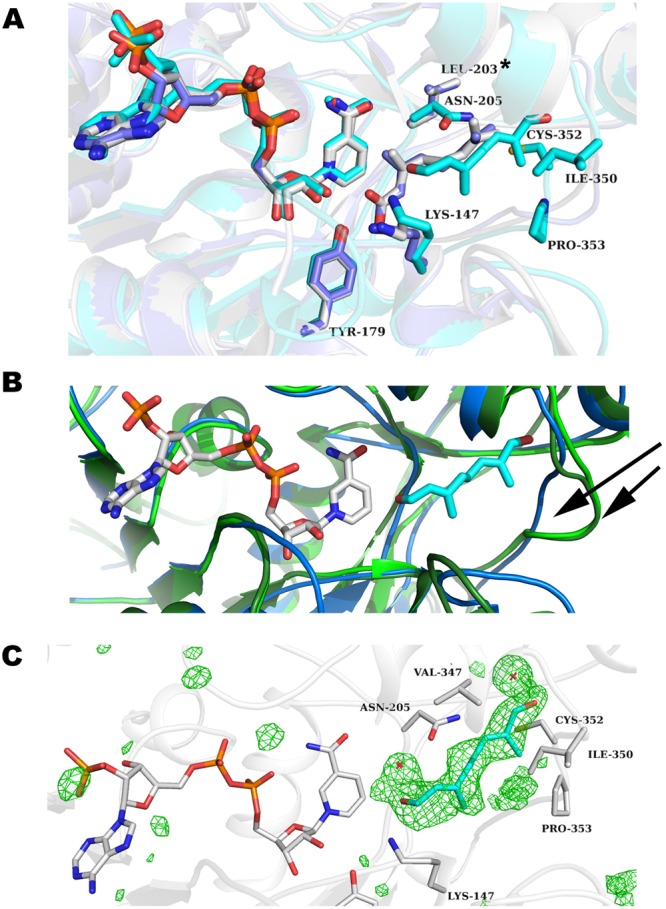
Figure 4.

Ligand binding pocket comparison. (A) Close-up view of the 8-oxogeranial binding site of PmMOR (carbons colored cyan) overlaid with 5DF1 (CrIS with NADP+ and geranic acid with carbons colored gray) and 5DBI (CrIS with NADP+ and 8-oxogeranial with carbons colored purple). Residues are labeled as per PmMOR numbering except LEU-203, which corresponds to CrIS. 8-oxogeranial is shifted away from the NADP+ in PmMOR versus CrIS. (B) Active site view highlighting the shifted loop between PmMOR (dark blue) and CrIS (dark and light green). The 349-DIPCPL-354 loop is indicated with black arrows. (C) Omit map contoured at +3.5 standard deviations (σ) above the mean shown in green mesh for the PmMOR/NADP+/8-oxogeranial structure. Selected side chain residues are drawn as sticks and labeled.
