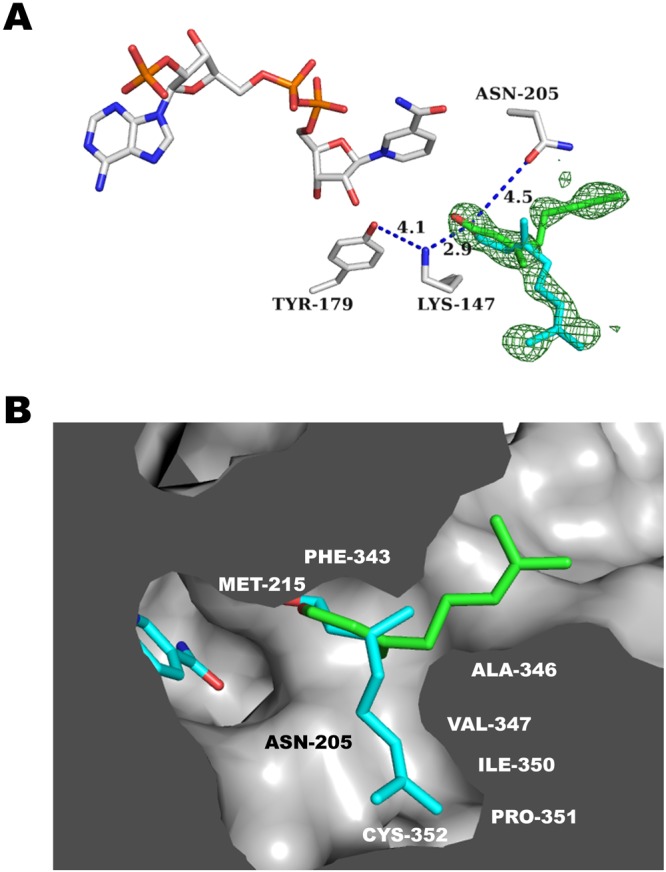
Figure 5.

PmMORV150M citral binding. (A) Close-up view of the active site showing putative catalytic residues for citral with distances shown as blue dashed lines and labeled. The two citral conformations are show with carbons in cyan and green. Omit map contoured at +3.5 standard deviations (σ) above the mean shown in green mesh. (B) A cutaway of the PmMOR active site is shown with the two citral binding modes colored as per A. Selected residues are labeled.
