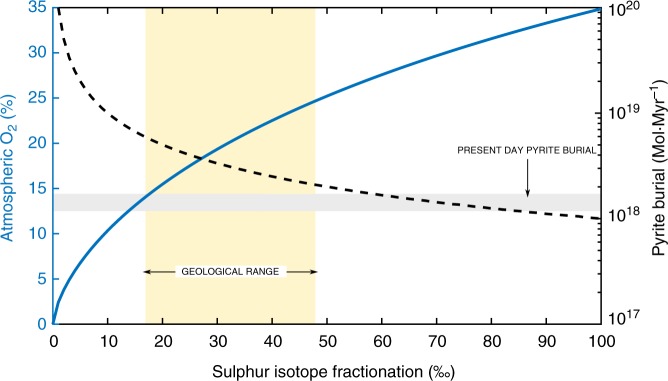
Fig. 2.
The relationship between sulphur isotope fractionation and oxygen concentration in GEOCARBSULF. The blue line shows the sulphur isotope fractionation (αs) generated by the equation used in the original GEOCARBSULF model for different concentrations of atmospheric O2, and the dashed black line shows the resultant pyrite burial flux. The yellow box represents the bounds of the geologic record for sulphur isotope fractionation between sulphate and pyrite over the last 570 Myrs, based on datasets from Wu et al.66 and the grey box represents estimated modern day pyrite burial levels75,76

