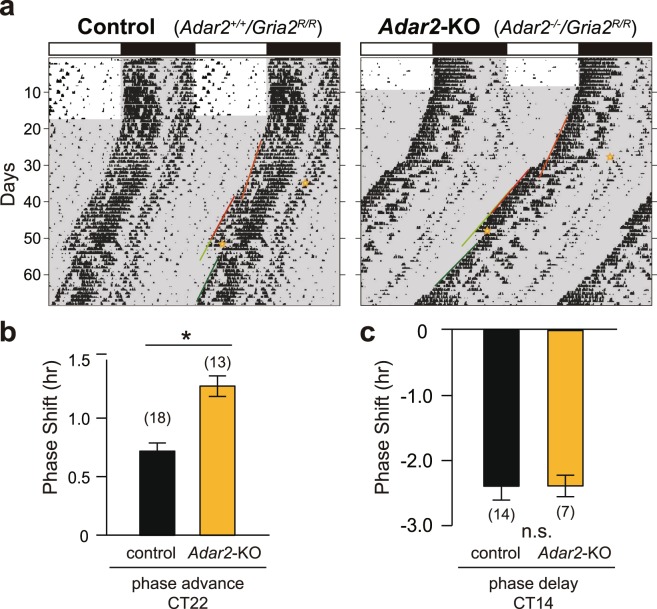
Figure 2.
Effects of light pulses on the circadian phase at two different circadian times in Adar2-KO mice. (a) Representative double-plotted actograms of wheel-running activity. The area with gray shading indicates the dark period. The light pulses (30 min, 300 lux) indicated by yellow stars were given first at CT22 and subsequently given at CT14. The red and green lines indicate the onset of activity used to calculate phase-advance and phase-delay of locomotor activity rhythms, respectively. (b,c) Phase-shift induced by a light pulse given at CT22 (b) or CT14 (c) (mean ± s.e.m.; n.s. P ≥ 0.05, *P < 0.05 by Student’s t-test). The numbers of animals are indicated in parentheses.

