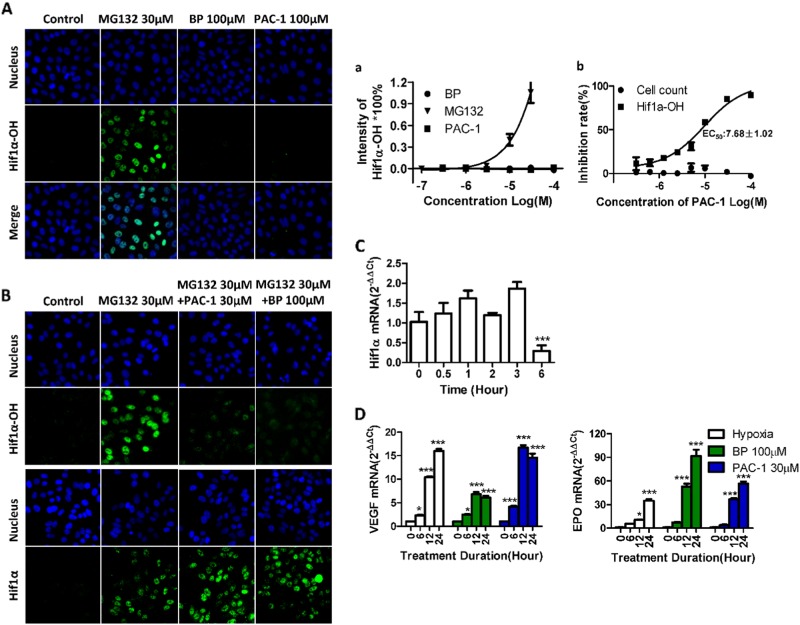
Fig. 3. Characteristics of the PAC-1-induced HIF1α.
A HepG2 cells were exposed to different compounds for 3 h before immunofluorescence labeling of hydroxylated HIF1α using Pro564 hydroxylated HIF1α-specific antibodies and quantitative analysis (a). (B) HepG2 cells were exposed to 30 μM MG132 with BP or different concentrations of PAC-1 for 3 h before immunofluorescence labeling of hydroxylated HIF1α or HIF1α using Pro564 hydroxylated HIF1α or HIF1α-specific antibodies and quantitative analysis (b). C HepG2 cells were exposed to 30 μM MG132 with 30 μM PAC-1 and 100 μM BP for 3 h before immunofluorescence labeling of HIF1α. D Changes in HIF1α mRNA levels in HepG2 cells exposed to 30 μM PAC-1. ***P < 0.001 compared with untreated cells. D mRNA levels of HIF1α target genes after HepG2 cells were exposed to compounds or cultured under hypoxic conditions (1% oxygen level) for the indicated times. Data represent means ± SEs of three independent experiments. *P < 0.05; ***P < 0.001; compared with the 0 h treatment group

