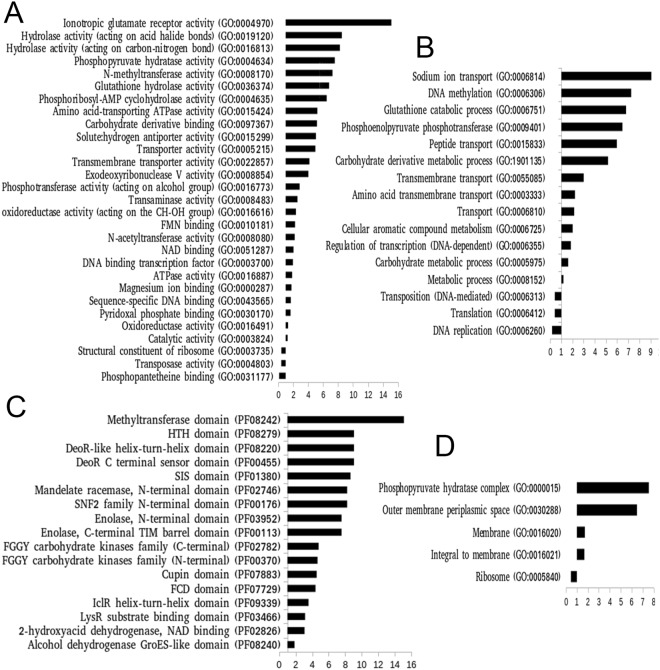
Figure 3.
Distribution of three Gene Ontology terms and Pfam domains among candidate HGTs. The diagram shows the relative abundance (odd ratio) of three ontology terms (A) Molecular function, (B) Biological process, (D) Cellular components, and (C) Pfam domains among the candidate HGTs in reference to their distribution in all protein-coding genes of 15 Mycobacterium species. Here, only the terms showing significant difference in relative abundance between the two groups are shown (P-values < 0.05). Significant differences are accessed through Fisher exact test with the null hypothesis that the functional annotations are distributed equally between the two groups (see main text for details).

