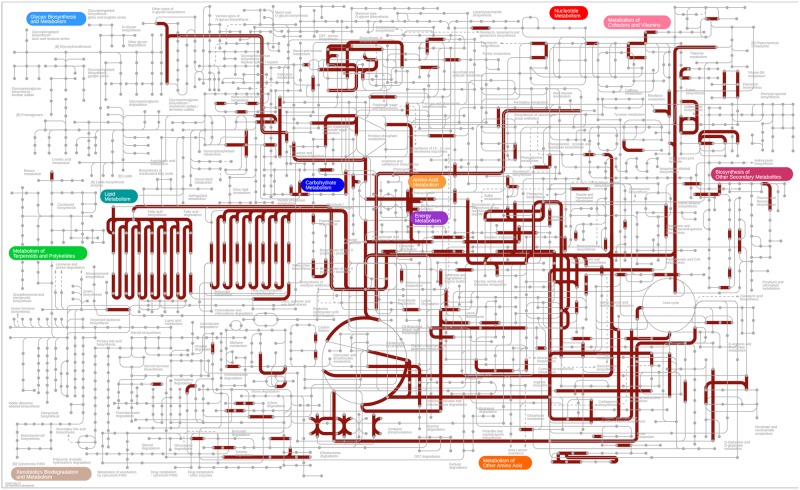
Figure 5.
Mapping of candidate HGTs onto the KEGG central metabolic pathways. The figure shows the distribution of candidate HGTs (shown in red thick lines) among the 11 major metabolic pathways in KEGG central metabolic pathways. The 11 major metabolic pathways are color-coded. Candidate HGTs were mapped using the iPath tool47 (v-3.0) following KEGG Orthology (KO) annotations as retrieved from KEGG database45 (see main text for details).

