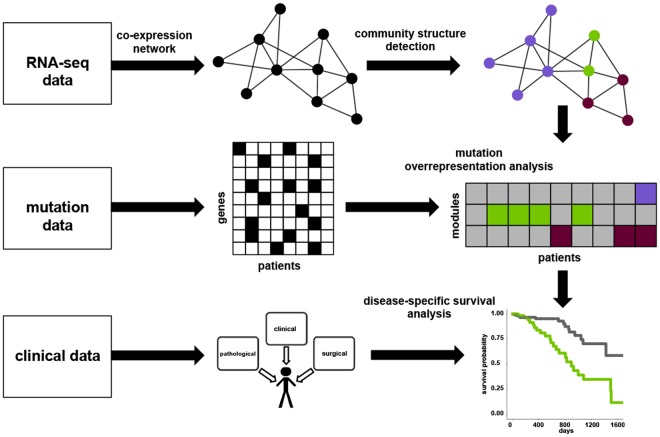
Figure 1.
Overall strategy. Co-expression networks were generated from RNA-seq data. Community structure detection was applied to partition the networks into modules (purple, green and maroon nodes). For each patient, genes with non-synonymous mutations were enumerated, then mapped to the network modules, and overrepresentation analysis was performed. Modules with (purple, green and maroon cells), or without (grey cells) significant enrichment for mutations were identified. Disease-specific survival analysis was then conducted.

