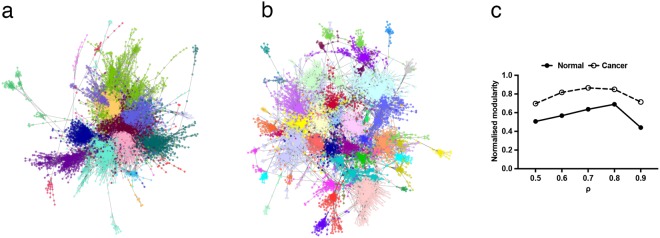
Figure 2.
Network visualization and community structure detection. (a) Normal tissue derived co-expression network. Edges included at ρ ≥ 0.8. Networks were visualised using the Cytoscape(49) perfuse force-directed layout algorithm, without knowledge of the identified community structure. Each community was assigned a colour according to the partitions identified by the Louvain algorithm. (b) Cancer tissue derived co-expression networks. All parameters as a. (c) Normalised modularity values for normal and tumour derived networks at different values of ρ.

