Figure 3.
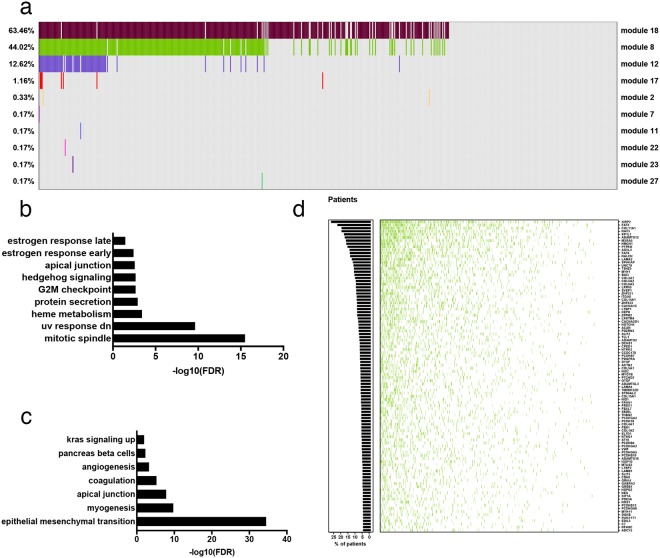
Mutation overrepresentation analysis. (a) Modules with a statistically significant number of mutated genes in the normal network (non-grey cells). Module number is indicated on the right hand side of the figure, overall representation within the cohort on the left. Colours correspond to the modules in Fig. 2a. Only modules enriched for mutations in at least one patient are shown. (b) Broad Institute Hallmark genesets enriched in module 18. (c) Broad Institute Hallmark genesets enriched in module 8. (d) The top 100 most frequently mutated genes in module 8. Each row corresponds to a gene, columns, patients. Green cells indicate that a gene is mutated in the corresponding patient. The histogram shows the percentage of patients with at least one mutation in each gene.

