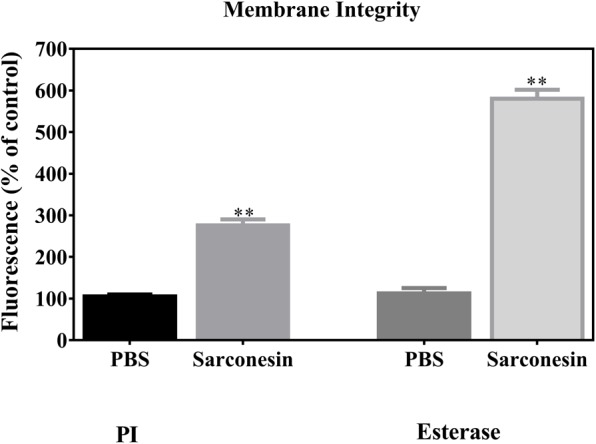
FIGURE 6.

Representative image showing change in the mean fluorescence intensity of fluorescence probes PI and CFDA (esterase activity) in E. coli bacteria. Histogram represents changes in the mean ± S.D of PI and CFDA fluorescence, obtained from three independent experiments (∗∗p < 0.05 vs. control).
