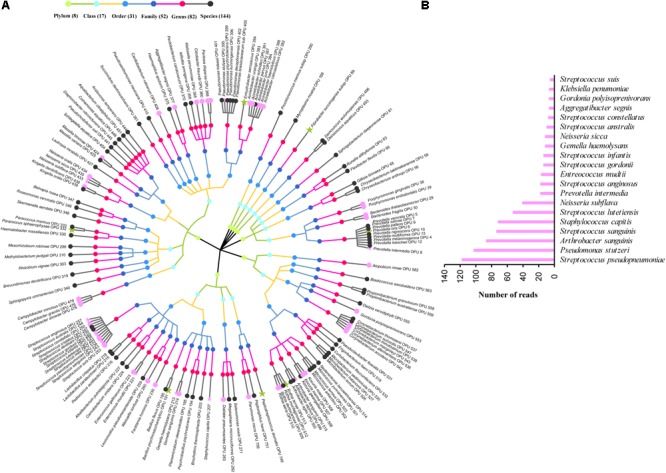
FIGURE 2.

Profiles of known species. (A) Taxonomic tree of 144 known species. Each dot represents a taxonomic entity. From the inner to the outer circles, the taxonomic levels range from phylum to species. Dots of different colors indicate different taxonomic levels according to the color key shown. Numbers in parentheses indicate the total number of unique taxonomies detected at each level. The most abundant species, which were composed of more than 10 reads are denoted by asterisk. Species in pink indicate those having medical significance, among which the top 20 species, which were composed of more than 10 reads are denoted by pink asterisk. (B) Sequences numbers of the top 20 known species having medical significance.
