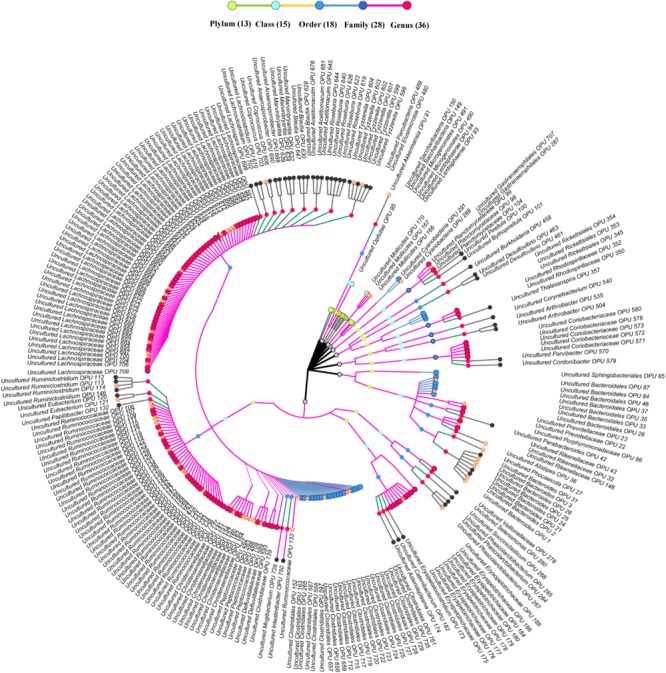
FIGURE 4.

Taxonomic tree of uncultured bacteria. Each dot represents a taxonomic entity. From the inner to the outer circles, the taxonomic levels range from phylum to genus. Dots of different colors indicate different taxonomic levels according to the color key shown. The outermost taxa of each OPU show the highest taxa level it can reach. Numbers in parentheses indicate the total number of unique taxonomies detected at each level. The core OPUs shared by all antelopes are showed by asterisk.
