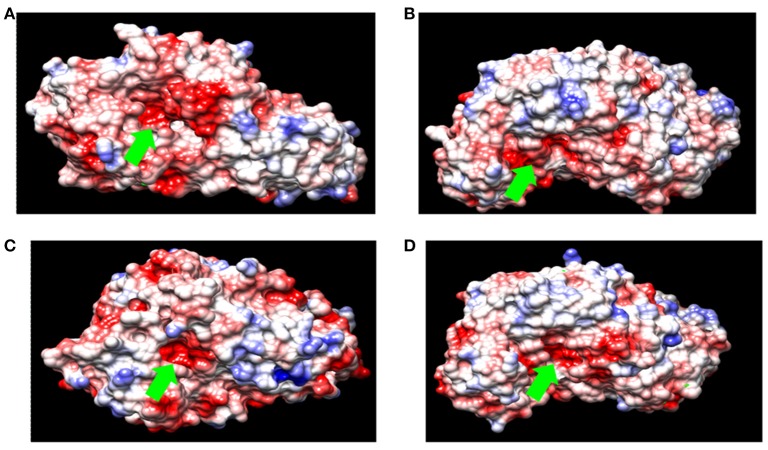
Figure 3.
Surface charge density of (A) α-amylase from B. acidicola (B) α-amylase from Bacillus sp. DR90 (C) α-amylase from B. licheniformis (D) α-amylase from Geobacillus thermoleovorans. (red for negative potential, white near neutral and blue for positive potential. Green arrow indicates catalytic active site of amylase).

