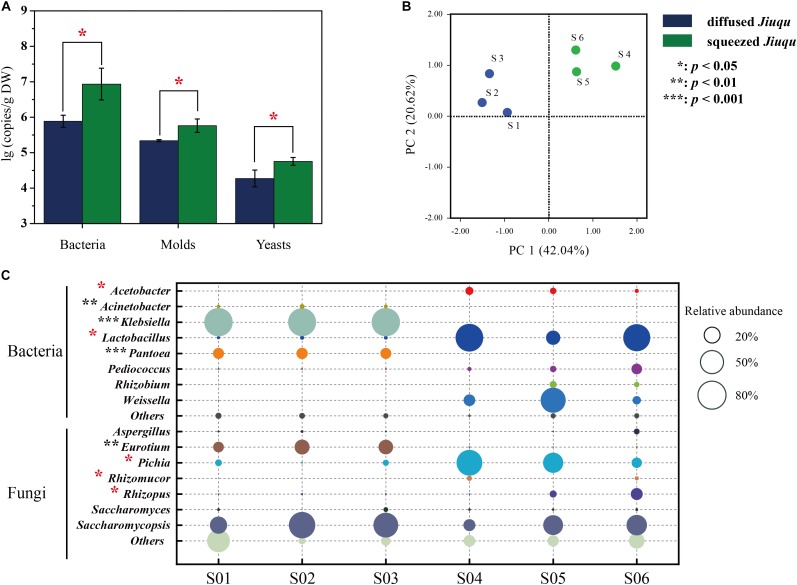
FIGURE 2.
Microbiota components analysis across all the samples. (A) The contents of bacteria, molds and yeasts were analyzed by RT-qPCR. (B) Amplicons analysis represented the similarities of microbial compositions based on principal component analysis (PCA). (C) The different microbiota content between diffused and squeezed Jiuqu represented in bacterial and fungal distribution. Compared to diffused Jiuqu, red and black asterisks denote statistically significant increase and decrease in squeezed Jiuqu (paired-sample t-test: ∗, p < 0.05; ∗∗, p < 0.01; ∗∗∗, p < 0.001).

