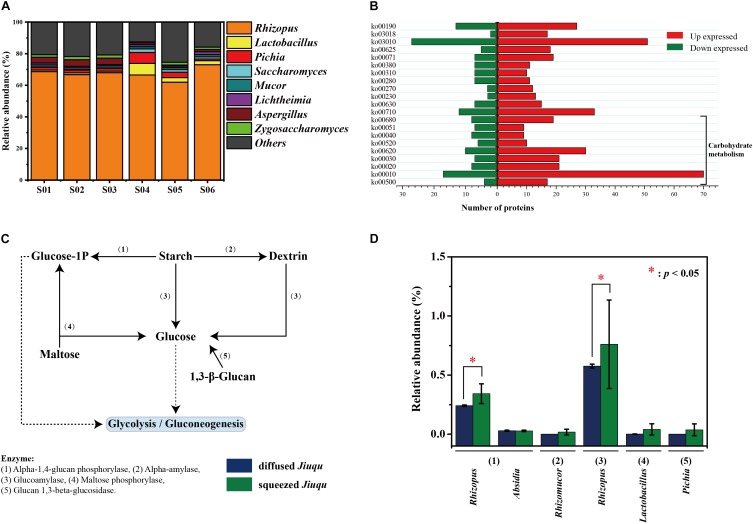
FIGURE 3.
Enzymatic profiles of diffused and squeezed Jiuqu. (A) Taxonomy distribution of diffused and squeezed Jiuqu (n = 6, each bar n = 3). (B) The number of significantly different expressed proteins between diffused and squeezed Jiuqu by KEGG annotation. (C) The dominant saccharifying process in Jiuqu starter. (D) The core enzymes and microbiota related to the saccharifying process in Jiuqu starter. Compared to diffused Jiuqu, red asterisks denote statistically significant increase in squeezed Jiuqu (paired-sample t-test: ∗, p < 0.05; ∗∗, p < 0.01; ∗∗∗, p < 0.001).

