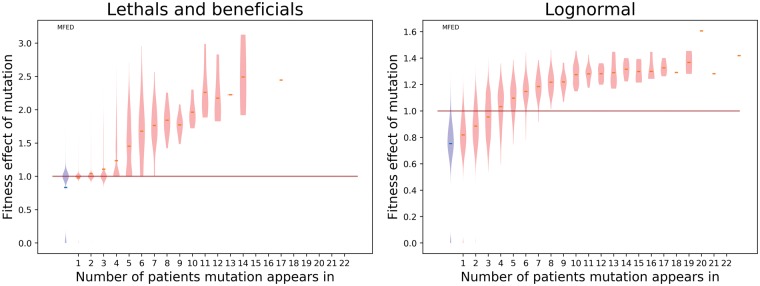
Figure 4.
Violin plot representing the distribution of fitness effects per frequency class, derived from hundred simulations using best-fit parameters for both models. The blue violin on the left represents the original MFED, the red lines indicate the median fitness effect in the respective frequency class.

