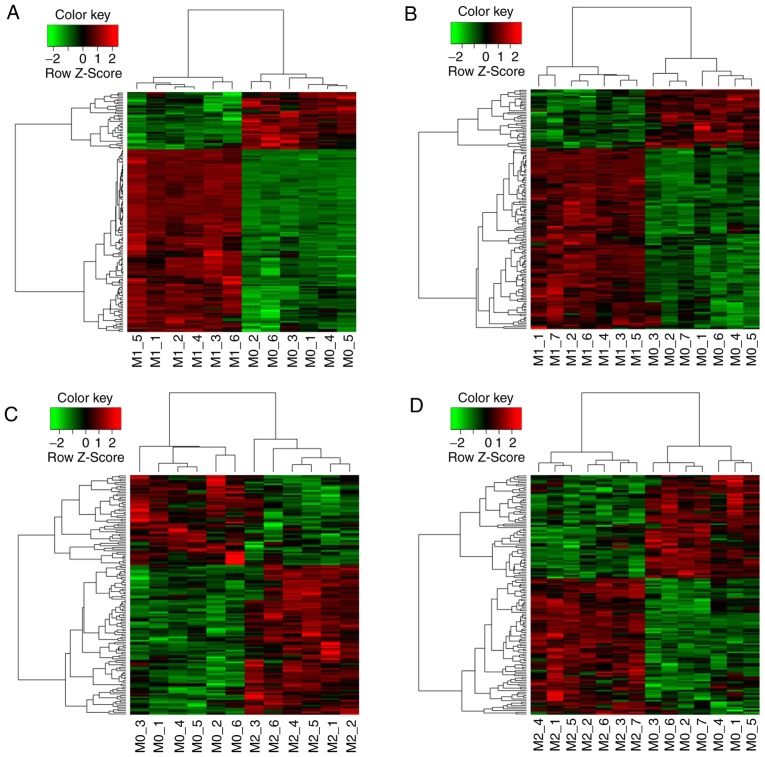
Figure 1.
Cluster analysis of intersecting differentially expressed genes. (A) Thermal graph from cluster analysis of the 151 intersecting differentially expressed genes of GSE18686 in the M1 vs. M0 group. (B) Thermal graph from cluster analysis of the 151 intersecting differentially expressed genes of GSE35449 in the M1 vs. M0 group. (C) Thermal graph from cluster analysis of the 144 intersecting differentially expressed genes of GSE18686 in the M2 vs. M0 group. (D) Thermal graph from cluster analysis of the 144 intersecting differentially expressed genes of GSE35449 in the M2 vs. M0 group. Red indicates upregulated gene expression and green indicates downregulated gene expression. Each column in the thermal graph represents a sample and each row represents a gene.

