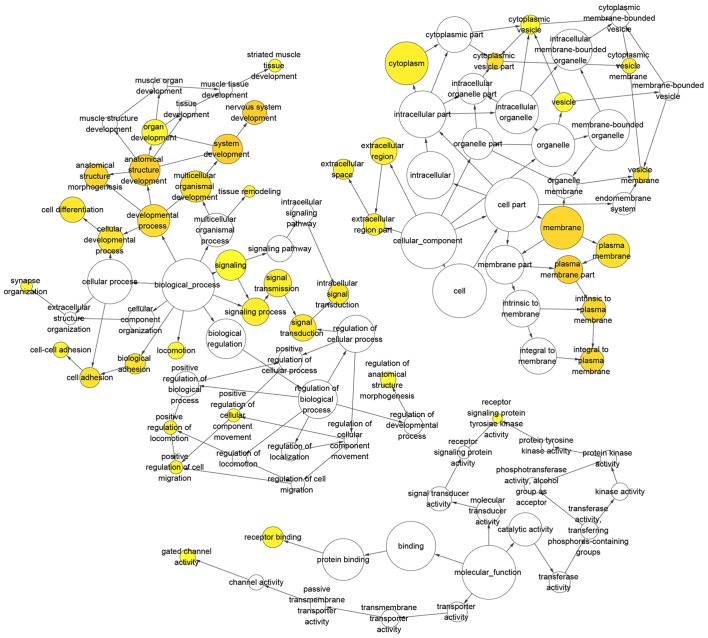
Figure 4.
Directed acyclic graph of GO enrichment analysis and DEG functional annotation. Circles represent GO function, the upstream GO function includes the downstream GO function (arrows) and the color intensity represents the degree of GO function enrichment. DEGs, differentially expressed genes; GO, gene ontology.

