Figure 5.
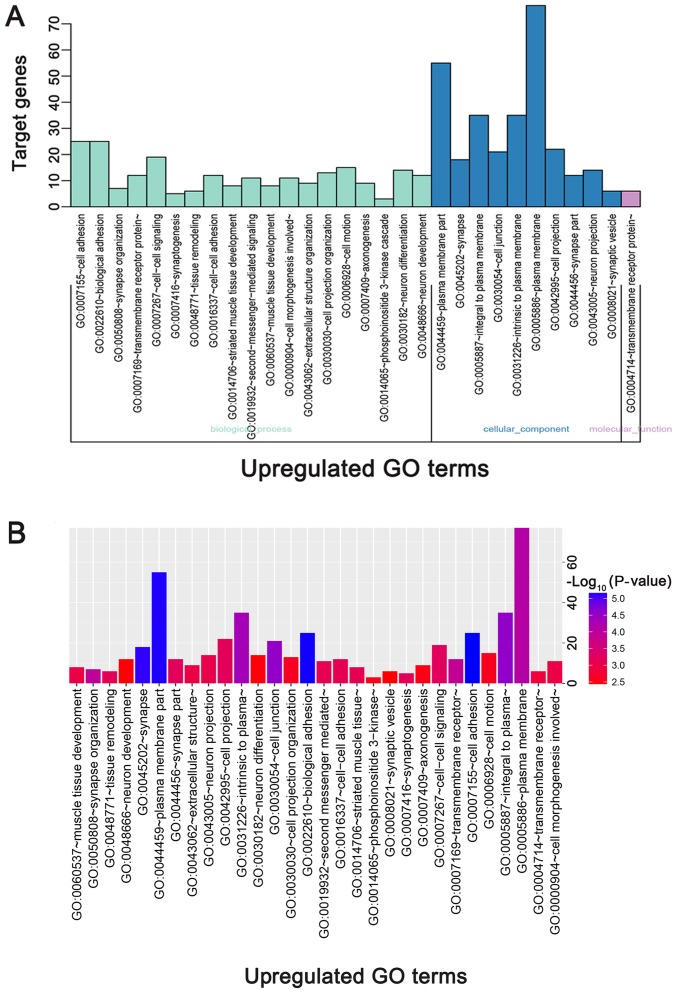
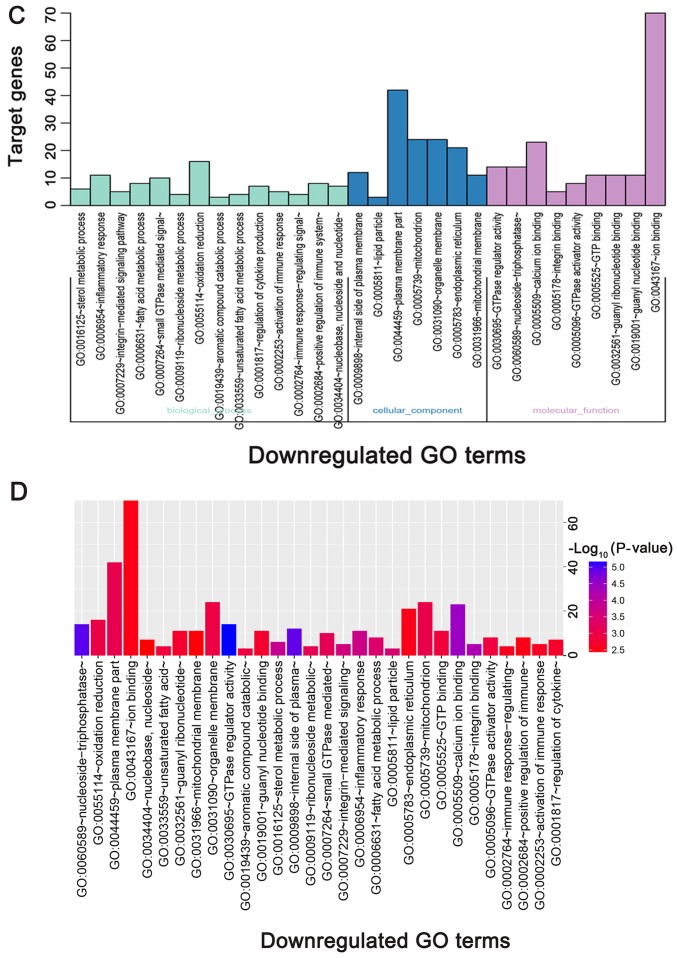
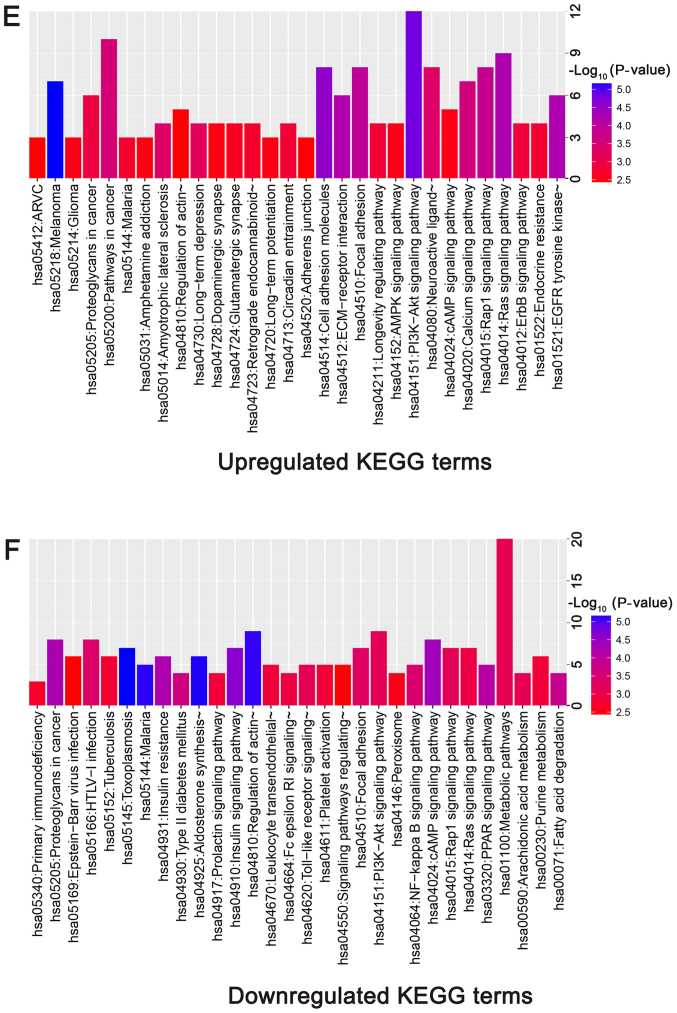
GO functional and KEGG pathway enrichment analysis of DEGs. (A) GO functional enrichment analysis of upregulated DEGs based on the three types of sub-ontologies and (B) P-value. (C) GO functional enrichment analysis of downregulated DEGs (top 30 terms) based on the three types of sub-ontologies and (D) P-value. The horizontal axis and vertical axis indicate the names of GO terms and the number of target genes, respectively. KEGG functional enrichment analysis of (E) upregulated and (F) downregulated DEGs (top 30 terms) are presented, based on P-value. The color of the pillars represents the size of the P-value, with the red color representing the smallest P-value. DEGs, differentially expressed genes; GO, gene ontology; KEGG, Kyoto Encyclopedia of Genes and Genomes.


