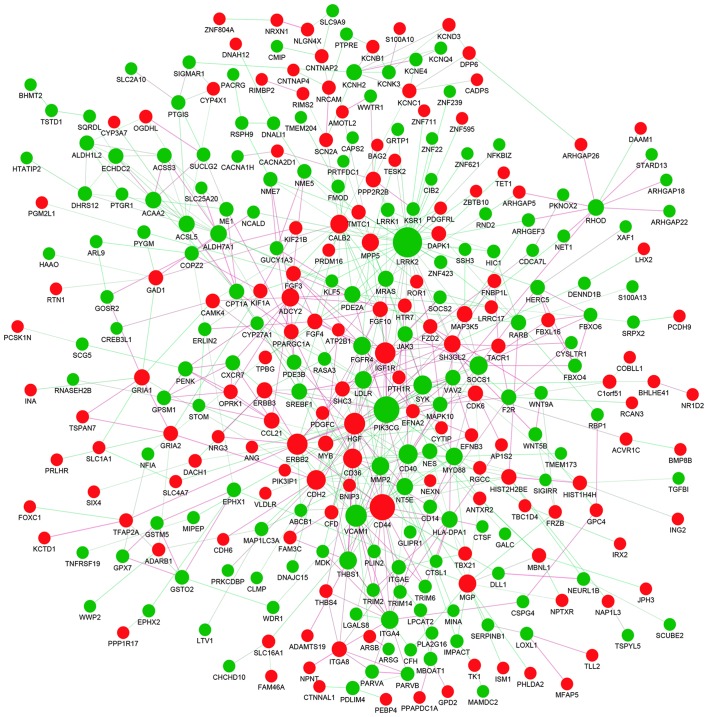
Figure 6.
Protein-protein interaction network of identified differentially expressed genes. Red nodes represent the upregulated genes, while green nodes represent the downregulated genes. The magnitude of each node represents the extent to which each gene is linked, and the lines represent the interaction relationship between nodes.

