Figure 3.
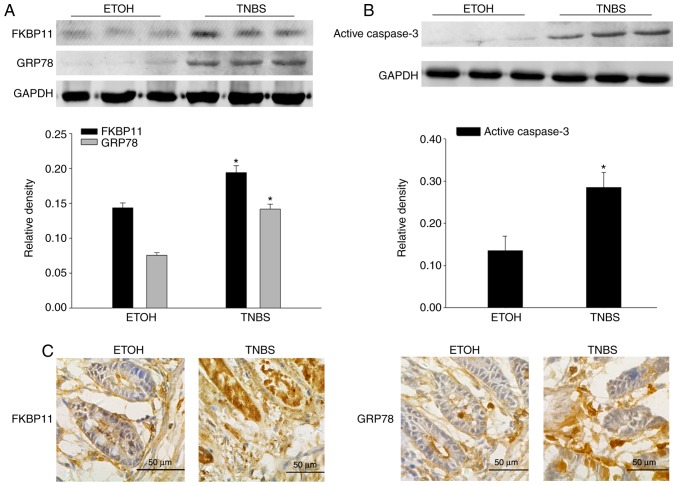
FKBP11 and GRP78 expression levels are increased in TNBS-induced colitis. Western blot analyses revealed that the expression levels of (A) FKBP11 and GRP78, and (B) active caspase-3 in TNBS induced colitis are significantly enhanced 3 days post-treatment compared with the ETOH group. Bar graphs demonstrate the quantitative analysis of FKBP11, GRP78 and active caspase-3 vs. GAPDH. (C) Immunohistochemistry analysis of FKBP11 and GRP78 expression in colonic mucosa of mice treated with TNBS for 3 days (scale bar, 50 µm). Data are presented as mean ± standard error (n=3). *P<0.05 vs. ETOH. ETOH, ethanol; TNBS, 2, 4, 6-trinitrobenzenesulphonic acid; FKBP11, FK506 binding protein 11; GRP78, 78 kDa glucose-regulated protein.

