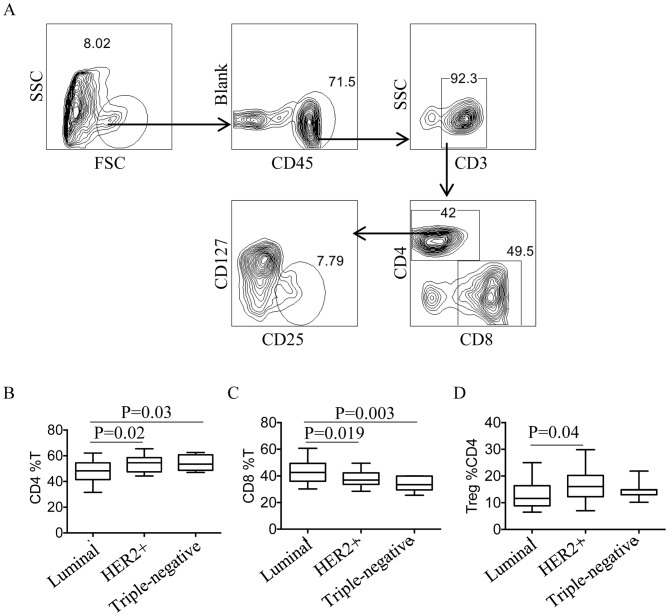
Figure 3.
Distribution of tumor-infiltrating T cell subsets in BC patients with different molecular subtypes. (A) The gating strategy for tumor-infiltrating T cell subsets by flow cytometry. Quantity comparison of (B) CD4+T cells, (C) CD8+T cells and (D) Tregs in BC patients with different molecular subtypes. All experiments were repeated three times. CD, cluster of differentiation; FOXP3, forkhead box protein P3; BC, breast cancer; Treg, regulatory T cell; SSC, side scatter; FSC, forward scatter; HER2+, human epidermal growth factor receptor.

