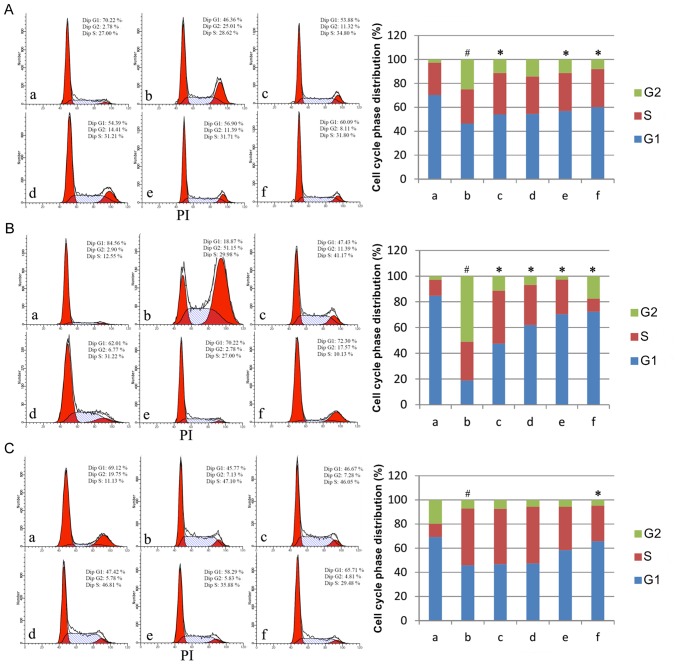
Figure 2.
Cell cycle phase distributions in the three cell lines. Cell cycle phase distributions of (A) the human pulmonary type II-like epithelial lung adenocarcinoma cell line A549, (B) the human umbilical vein endothelial cell line CRL-1730, and (C) the human bladder carcinoma cell line ECV304. A, Untreated control group (no LPS, no AM); b, LPS group (1 µg/ml), and the four LPS+AM groups treated with LPS (1 µg/ml); plus c, 25; d, 50; e, 100; and f, 200 µg/ml of AM. Data are presented as the mean ± standard deviations from three independent experiments. #P<0.05 vs. control group a, and *P<0.05 vs. LPS group b, with one-way analysis of variance followed by Bonferroni post-hoc test. AM, Astragalus membranaceus; LPS, lipopolysaccharide.

