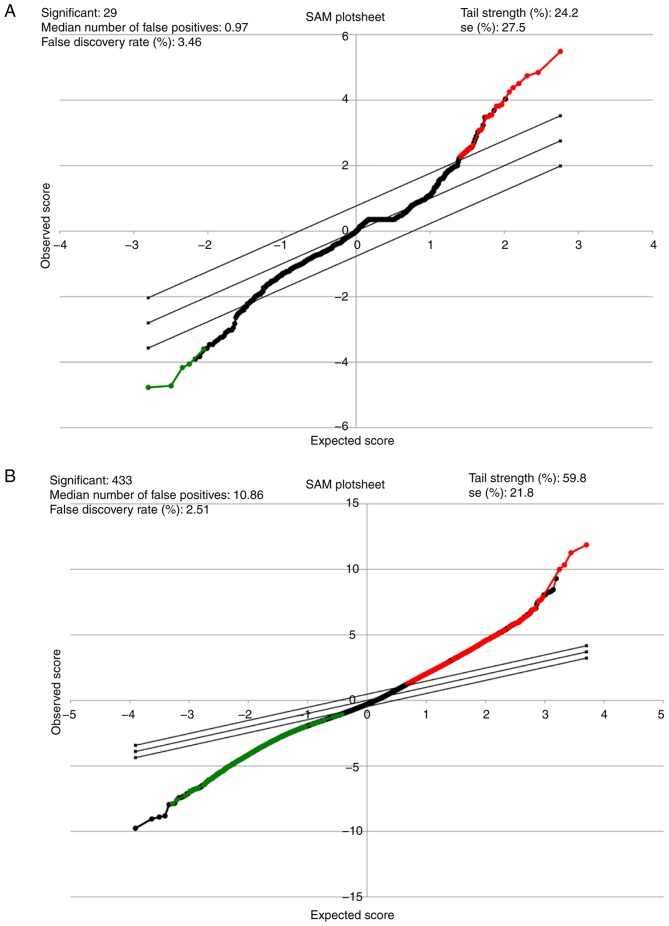
Figure 1.
Significance analysis of microarrays (SAM) for miRNA and mRNA from patients with IPF. (A) Representative SAM plot sheet for GSE24206 (n=23) and (B) GSE27430 (n=25) in patients with IPF compared with the normal lung tissues. In the SAM plot sheet, red represents miRNAs or genes upregulated, while green represents miRNAs or genes downregulated. miRNA, microRNA; SAM, significance analysis of microarrays; IPF, idiopathic pulmonary fibrosis.

