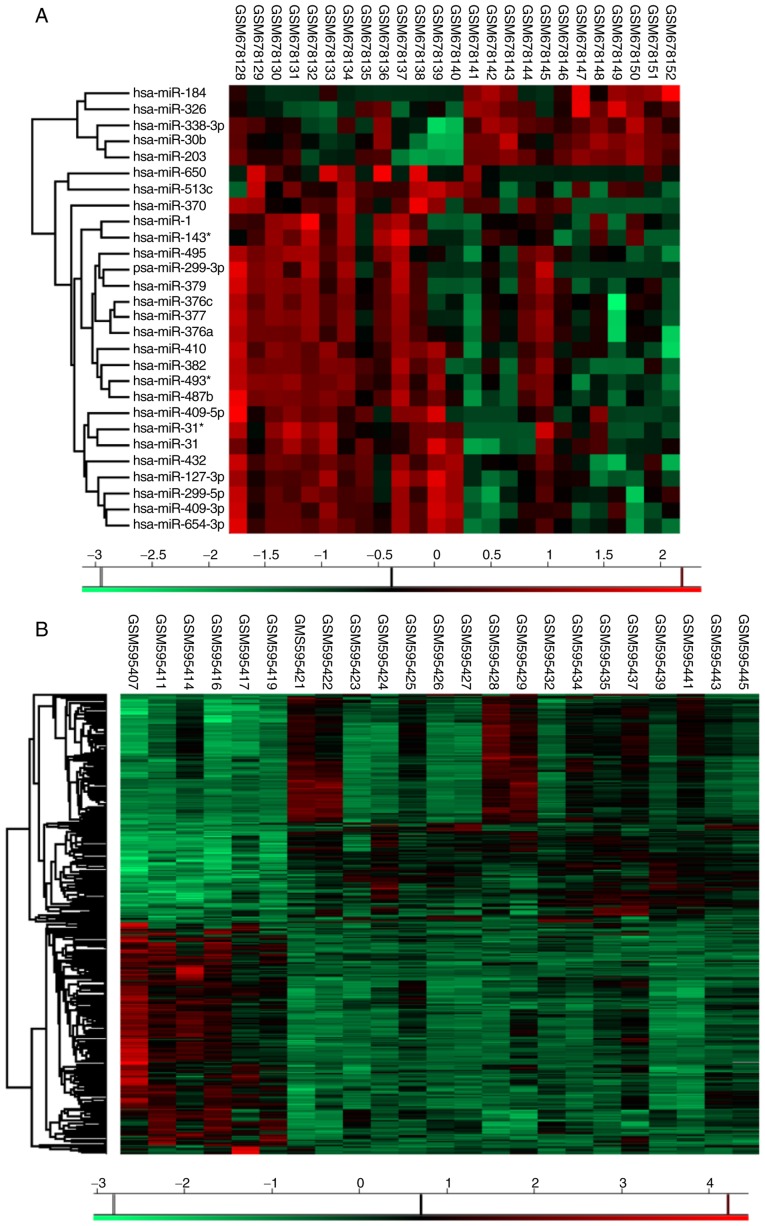
Figure 2.
Unsupervised hierarchical clustering analysis. Differentially expressed (A) miRNAs and (B) genes in idiopathic pulmonary fibrosis patients. In these heatmaps, red represents gene upregulated and green represents genes downregulated. miRNA, microRNA; SAM, significance analysis of microarrays; IPF, idiopathic pulmonary fibrosis.

