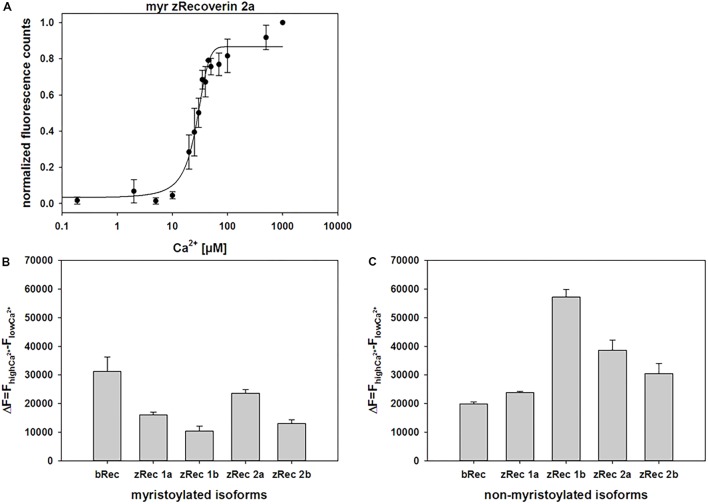
FIGURE 4.
Normalized fluorescence emission of ANS interacting with myristoylated zRec2a. (A) Representative titration of 2 μM zRec2a with increasing [Ca2+] causing an increase of the ANS fluorescence emission. ANS fluorescence spectra were measured by excitation at 380 nm and emission spectra were recorded between 400 and 550 nm. Maximal fluorescence emission was normalized and plotted as a function of free [Ca2+]. After recording, all measurements of the same isoform were normalized, averaged and half maximal value (K1/2) was determined by SigmaPlot 13. K1/2 of myristoylated zRec2a was 22.6 ± 2 μM. (B) Fluorescence spectra of ANS were measured at high [Ca2+] of 500 μM and at low [Ca2+] of 1000 μM EGTA. Difference (ΔF) between high and low [Ca2+] showed the change in fluorescence intensity along myristoylated (B) and non-myristoylated (C) recoverin isoforms.

