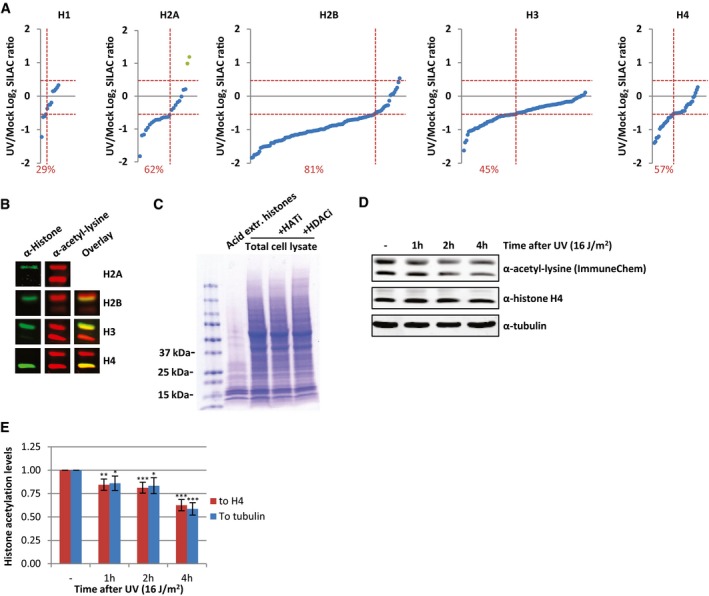
Identified acetylated peptides per histone plotted against their log2 SILAC ratio (1 h after 16 J/m2 UV/mock), ranked by SILAC ratio. Green dots represent the identified peptides from histone variant H2AZ. The percentage of peptides with a SILAC ratio < −0.5 are indicated in red.
Western blots of WCE from HeLa cells stained with α‐histone H2A, α‐histone H2B, α‐histone H3, and α‐histone H4 (depicted in green) and α‐acetyl‐lysine (depicted in red) indicating that the strong acetyl‐lysine signal of the low molecular weight bands originates from acetylated core histones. H2A and acetyl‐lysine antibodies were raised in the same species and therefore did not allow an overlay.
Coomassie staining of extracted histones and WCE from the same number of HeLa cells, treated with HATi (CTK7A, 100 μM and CPTH2, 50 μM) or HDACi (TSA, 1 μM) or mock‐treated.
Western blots of HeLa cells lysed at different time points after irradiation with UV (16 J/m2). Blots were stained with α‐acetyl‐lysine (Immunechem, top panel), α‐histone H4 (middle panel), and α‐tubulin (bottom panel).
Quantification of the α‐acetyl‐lysine signal normalized against either the histone H4 levels (red bars) or tubulin levels (blue bars). Error bars represent SEM. N = 7. Significant differences between UV‐treated and mock‐treated conditions are calculated with t‐test and indicated with *P < 0.1, **P < 0.05, and ***P < 0.01.

