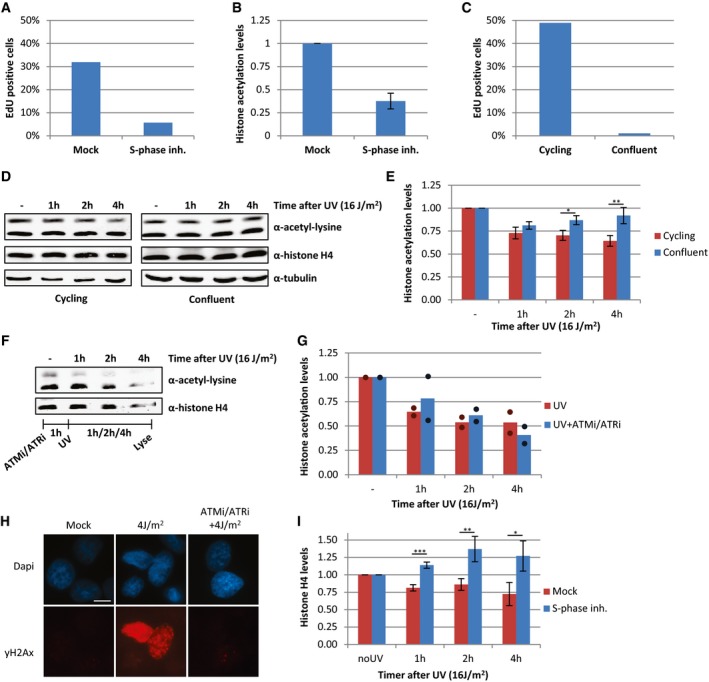
Relative amount of HeLa cells positively stained for EdU incorporation (2 h, 20 μM), quantified from immunofluorescence images (> 120 cells analyzed).
Quantification of histone acetylation levels, normalized against histone H4 levels of HeLa cells that are cultured with S‐phase inhibitor (10 μM, o/n) or mock‐treated. Error bars represent SEM, N = 5.
Relative amount of EdU‐positive, cycling, or contact‐inhibited (confluent) VH10 cells, quantified from immunofluorescence images (> 100 cells analyzed).
Western blots of WCE from confluent (right panel) or cycling (left panel) VH10 cells lysed at different time points after UV (16 J/m2). Blots were stained with α‐acetyl‐lysine (top panel), α‐histone H4 (middle panel), and α‐tubulin (bottom panel).
Quantification of histone acetylation levels in confluent or cycling VH10 cells at different time points in which the histone acetylation levels are normalized against histone H4 levels after UV (16 J/m2). N = 3, error bars represent SEM. Significance of differences between cycling and confluent cells is calculated by t‐test and indicated with *P < 0.1 and **P < 0.05.
Western blot of WCE, made at different time points after UV irradiation (16 J/m2) from HeLa cells pre‐treated for 1 h with a combination of ATM (Ku55933, 10 μM) and ATR (VE‐821, 10 μM) inhibitors.
Quantification of histone acetylation levels in cells treated with ATM and ATR inhibitors an hour before UV irradiation (16 J/m2). Bar graph represents mean, and dots represent individual data points. N = 2
Representative immunofluorescence images of γ‐H2AX staining following, mock treatment, UV‐induced DNA damage (4 J/m2) with or without ATM and ATR inhibitors as indicated. Scale bar 10 μm.
Quantification of histone H4 levels in HeLa cells pre‐treated o/n with an S‐phase inhibitor (PHA 767491 hydrochloride, 10 μM) and lysed at indicated time points after UV (16 J/m2). N = 5, error bars represent SEM, and data are normalized against tubulin levels. Significant differences, calculated with t‐test, between UV‐irradiated and inhibitor‐treated conditions are indicated with *P < 0.1, **P < 0.05, and ***P < 0.01.

