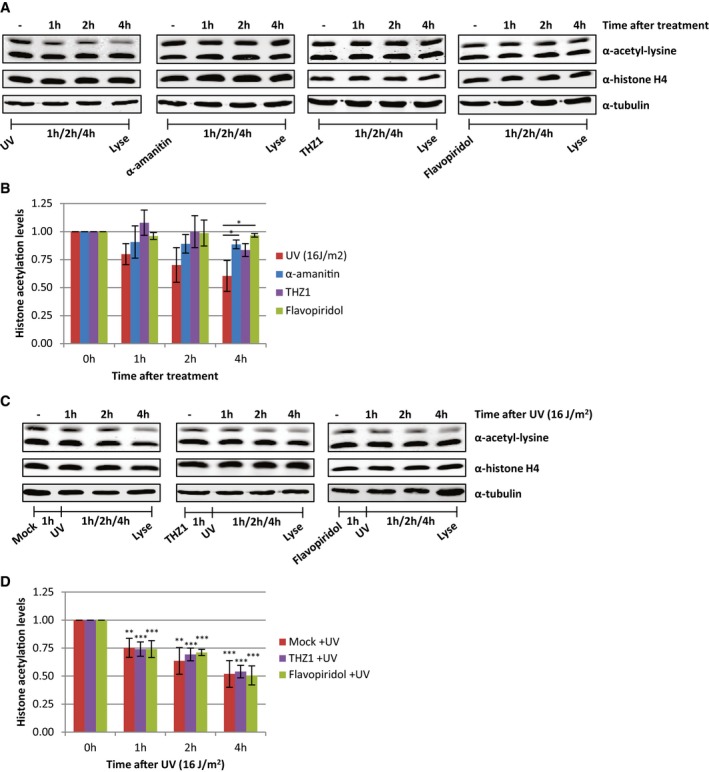
Representative Western blots of histone acetylation levels of HeLa cells lysed at indicated time points after UV irradiation (16 J/m2, left panel), α‐amanitin (second panel, 100 μg/ml), THZ1 (third panel, 1 μM), or flavopiridol (right panel, 1 μM) treatment. Blots were stained with α‐acetyl‐lysine (top panel), α‐histone H4 (middle panel), and α‐tubulin (bottom panel).
Quantified histone acetylation levels, normalized against histone H4 levels for quantification. Average of at least three experiments. Error bars represent SEM. Significant differences, calculated by t‐test, between UV‐irradiated and inhibitor‐treated conditions are indicated with *P < 0.1.
Representative Western blots of histone acetylation levels of HeLa cells pre‐treated with transcription inhibitors [mock (left), THZ1 (middle, 1 μM), or flavopiridol (right, 1 μM)] an hour before UV irradiation and lysed at the indicated time points after UV (16 J/m2). Blots were stained with the indicated antibodies.
Quantification of α‐acetyl‐lysine signal, normalized against histone H4 levels. Average of five experiments. Error bars represent SEM. Significant differences, calculated by t‐test, between UV‐treated and mock‐treated conditions are indicated with **P < 0.05 and ***P < 0.01.

