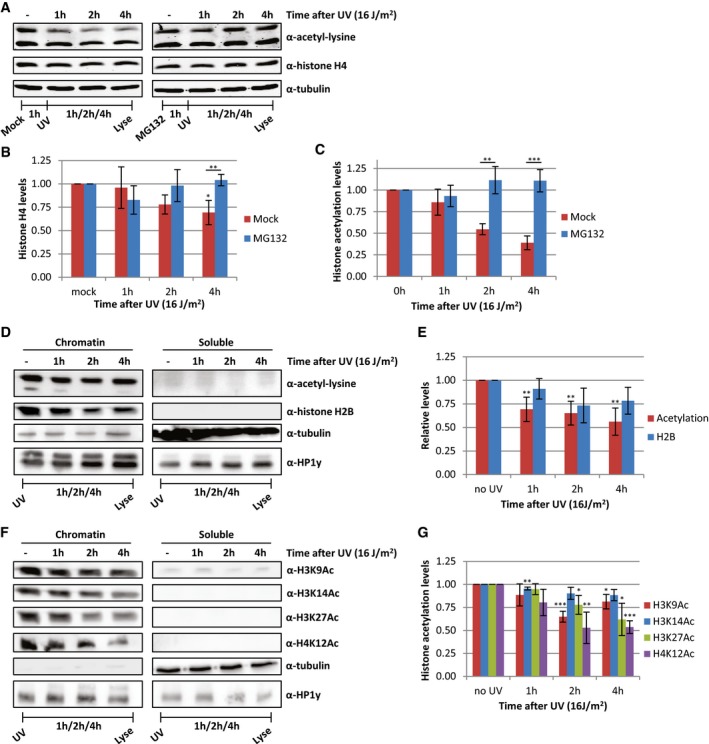
Figure 6. Proteasomal degradation of acetylated histones following replication stress.

-
A–C(A) Western blots of HeLa cells treated with proteasome inhibitor MG132 1 h before UV irradiation and lysed at different time points after UV (16 J/m2). Blots were stained with α‐acetyl‐lysine (top panel), α‐histone H4 (middle panel), and α‐tubulin (bottom panel). Quantifications of (B) histone H4 levels and (C) acetylation levels, normalized against tubulin levels. Average of six experiments, and error bars represent SEM. Representative blots are shown in panel (A).
-
DFractionation experiments comparing histone and acetylation levels in chromatin and soluble fractions at the indicated time points after UV irradiation (16 J/m2). HP1y was used as loading control for chromatin fraction, tubulin for soluble fraction.
-
EQuantification of histone acetylation and H2B levels in chromatin fraction. Non‐irradiated samples were set as 1. N ≥ 4, error bars indicate SEM.
-
FRepresentative Western blots of fractionated cell extracts of HeLa cells at indicated time after UV irradiation (16 J/m2) using histone modification‐specific antibodies. Loading controls for H3K9 and H3K27 are depicted in Figure 6D.
-
GQuantification of the signal of the indicated histone modification‐specific antibodies stainings in the chromatin fraction. N ≥ 4 and error bars represent SEM.
