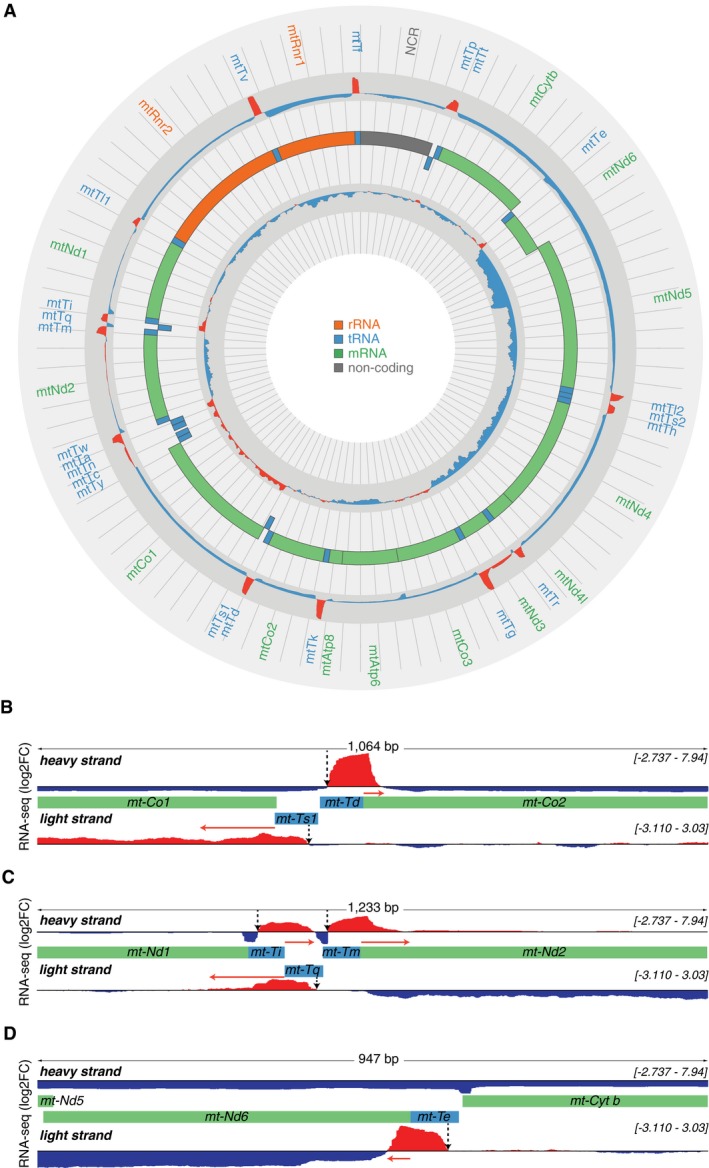
Figure 3. Transcriptome‐wide analyses of 3′ tRNA cleavage sites by RNA‐Seq.

- A complete map of changes in mitochondrial RNA abundance determined by RNA‐Seq coverage (log2 fold change[KOmean/Ctrlmean]) from three control (L/L) and three knockout (L/L, cre) mice, on heavy (outer track) and light (inner track) strands. Increases are shown in red and decreases in blue. The mitochondrial genome is displayed in the central track; rRNAs are displayed in orange, mRNAs in green, tRNAs in blue and the non‐coding region (NCR) in gray. The log fold change scale for the heavy strand is −3 to 8.5 and for the light strand is −3.3 to 3.3.
- Genome browser view of the mean RNA‐Seq coverage (log2 fold change[KOmean/Ctrlmean]) showing the 3′ cleavage sites of mt‐tRNA Asp and mt‐tRNA SerAGY by ELAC2. Regions of interests are shown in green (for mRNAs) and blue (for tRNAs) boxes.
- Genome browser view of the mean RNA‐Seq coverage (log2 fold change [KOmean/Ctrlmean]) showing the 3′ cleavage sites of a cluster of tRNAs, mt‐tRNA Ile, mt‐tRNA Met, and mt‐tRNA Gln by ELAC2. Regions of interests are shown in green (for mRNAs) and blue (for tRNAs) boxes.
- Genome browser view of the mean RNA‐Seq coverage (log2 fold change[KOmean/Ctrlmean]) showing the 3′ cleavage site of mt‐tRNA Glu by ELAC2. Regions of interests are shown in green (for mRNAs) and blue (for tRNAs) boxes.
