-
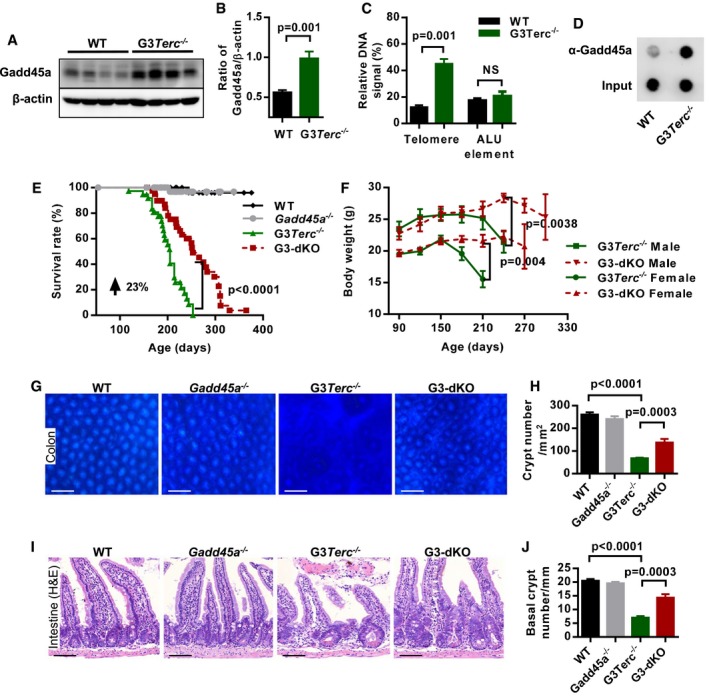
A, B
Western blotting analysis of Gadd45a protein expression in mouse intestine crypt lysates from WT and G3Terc
−/− mice (A). Quantification of Gadd45a protein expression, β‐actin protein level was used as the loading control (n = 7 mice per genotype), two independent experiments were carried out (B). P‐values were calculated with unpaired two‐tailed Student's t‐test.
-
C
Quantification of Gadd45a‐ChIP values as percentage of total telomeric DNA and ALU elements in WT and G3Terc
−/− MEF cells (n = 3 for each genotype). P‐values were calculated with unpaired two‐tailed Student's t‐test.
-
D
Dot‐blot assay following Gadd45a‐ChIP in WT and G3Terc
−/− MEF cells.
-
E
Kaplan–Meier survival curves of the mice with indicated genotypes (WT, n = 44; Gadd45a
−/−, n = 48; G3Terc
−/−, n = 37; G3‐dKO, n = 41). P‐value comparing the survival of G3Terc
−/− with G3‐dKO mice was calculated with the log‐rank test.
-
F
The average body weight of mice with indicated genotypes at indicated time points (G3‐dKO female (n = 19) versus G3Terc
−/− female (n = 17), P = 0.004; G3‐dKO male (n = 14) versus G3Terc
−/− male (n = 14), P = 0.0038). P‐values were calculated with log‐rank test.
-
G, H
Whole‐mount images of colon samples from 7‐month‐old mice with indicated genotypes (G). Quantification on density of colon crypts (H) (n = 5 mice per group). P‐values were calculated with unpaired two‐tailed Student's t‐test.
-
I, J
H&E‐stained small intestine sections from 7‐month‐old mice with indicated genotypes (I). Quantification of the number of small intestine basal crypts (J) (n = 5–6 mice per group). P‐values were calculated with unpaired two‐tailed Student's t‐test.
Data information: Scale bars represent 200 μm in (G) and 50 μm in (I). Data are presented as mean ± SEM.

