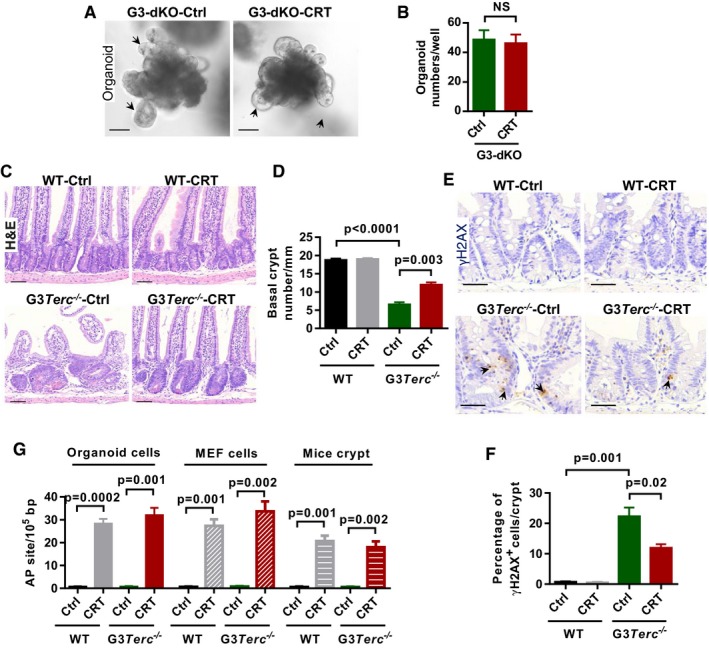
Representative images of small intestine organoids from G3‐dKO mice incubated with or without APE1 inhibitor CRT0044876 (CRT, 10 μM) treatment. Arrows indicate the crypt‐like structure in organoid cultures.
Quantification of organoid number (per well) from crypt cultures (n = 3–4 mice per treatment).
H&E‐stained small intestine sections from 7‐month‐old mice treated with or without APE1 inhibitor CRT0044876 (CRT).
Quantification of the number of small intestine basal crypts (n = 4 mice per group).
Representative images of γH2AX antibody staining on small intestine sections from WT and G3Terc
−/− mice treated with or without APE1 inhibitor CRT0044876 (CRT). Arrows indicate γH2AX‐positive nuclei.
Quantification of the percentage of γH2AX‐positive cells per small intestine crypt (n = 4 mice per group).
Inhibition efficiency of enzyme activity by using APE1 inhibitor CRT0044876 (CRT). Relative AP site accumulation was used as an indicator for enzyme activity inhibition. Organoid and MEF cells were treated with and without CRT0044876. Crypt isolated from WT and G3Terc
−/− mice treated with and without CRT0044876 (n = 3 replicates per group).
Data information: Scale bars represent 50 μm in (A and C); 25 μm in (E). Data are presented as mean ± SEM.
P‐values were calculated with unpaired two‐tailed Student's
t‐test.

