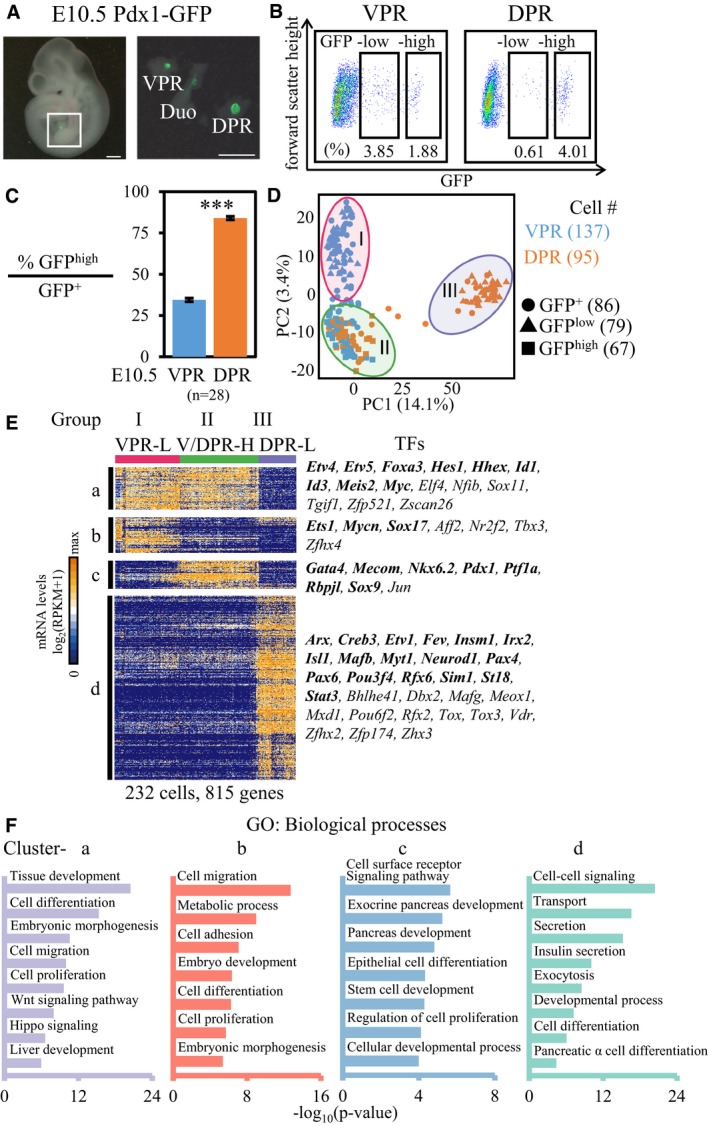
The VPR and DPR (right) were dissected from E10.5 Pdx1‐GFP embryos (left). Scale bar: 500 μm. DPR, dorsal Pdx1‐expressing region; VPR, ventral Pdx1‐expressing region; Duo, duodenum bud.
FACS gating for sorting GFPlow and GFPhigh cells from the VPR and DPR.
The ratios of GFPhigh cells to GFP+ cells in the VPR and DPR. The data show the mean ± SEM; n = number of independent biological replicates, unpaired t‐test. ***P‐value < 0.001.
PCA plot of single‐cell RNA‐transcriptomes of GFP+ (circle), GFPlow (triangle), and GFPhigh (square) cells from the VPR (blue) and DPR (orange). Each point represents a single cell. Three groups of cells are included in three colored circles.
Hierarchical clustering of 815 genes correlating with the first two PCs identified three groups of cell types and four major distinct clusters (a–d) of genes (P < 1 × 10⁻⁹, cell cycle‐related genes are excluded). Each column is a single cell, and each row represents one gene. Cluster‐specific TFs are listed on the right. The genes in bold are known to have roles in pancreatic development. L, GFPlow; H, GFPhigh.
Selected GO categories enriched among the four clusters of genes in (E).

