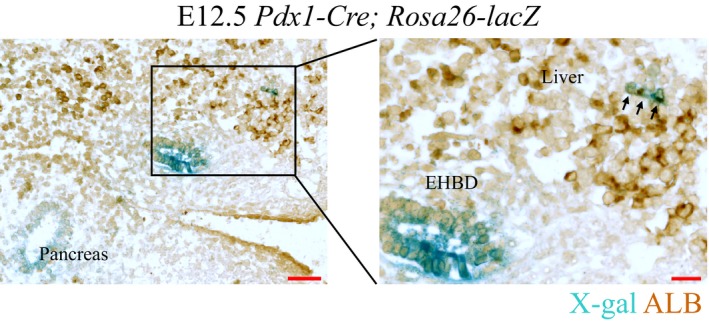
Figure 5. Hepatic potential of ventral Pdx1‐expressing cells.

Sagittal section of E12.5 Pdx1‐Cre; Rosa26‐LacZ mouse embryo counterstained for ALB (brown). X‐gal staining (blue) showing cells derived from Pdx1‐expressing cells. The arrowheads indicate cells co‐stained with X‐gal and ALB (see Fig EV5D for more images of different sections). EHBD, extrahepatic bile ducts. Scale bar: 50 μm (left) or 20 μm (right).
