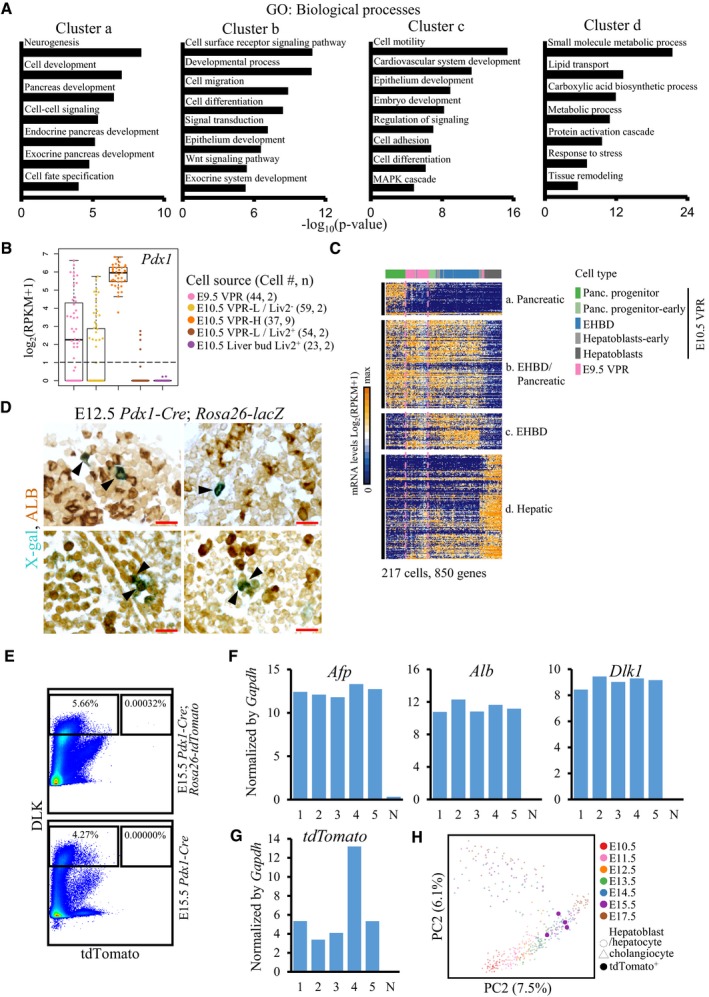
Figure EV5. Three cell lineages in E10.5 GFP low VPR cells.

-
ASelected enriched GO categories of cluster “a–d” genes in Fig 4D.
-
BExpression of Pdx1 in the cells from VPR or liver bud. Each point represents a cell. The y‐axes of the box plots represent the expression levels (log2(RPKM+1)). Central line in the box represents median; box limits represent the first and third quartile; whiskers represent 1.5 × interquartile range. Cell # = the number of cells. n = number of independent biological replicates.
-
CHierarchical cluster of 850 genes correlated with PC1 and PC2 of the corresponding cells indicates that the majority of E9.5 VPR cells were not specified into the three lineages of E10.5 VPR cells (P < 1 × 10⁻⁶). Each column represents a single cell, and each row represents one gene.
-
DGenetic tracing of Pdx1‐expressing cells in the liver. The arrowheads denote cells co‐stained with X‐gal and ALB in each section. Scale bar: 20 μm.
-
EFACS gating strategies used to sort tdTomato+/DLK+ cells from the E15.5 liver tissue.
-
F, GThe expression levels of Afp, Alb, Dlk1, and tdTomato in tdTomato+/DLK+ cells from the liver were validated by single‐cell RT‐qPCR. N, tdTomato− cell control. Cells were sorted from five E15.5 Pdx1‐Cre; Rosa26‐tdTomato liver tissue. 1–5 represent five individual tdTomato+ cells.
-
HPCA plot of single‐cell transcriptomes from tdTomato+ cells and embryonic hepatobiliary cells from previous study 53. Each dot represents a single cell.
