
Figure EV3. Conserved KAP1 binding and H3K9me3 at ERVs and ZNFs.
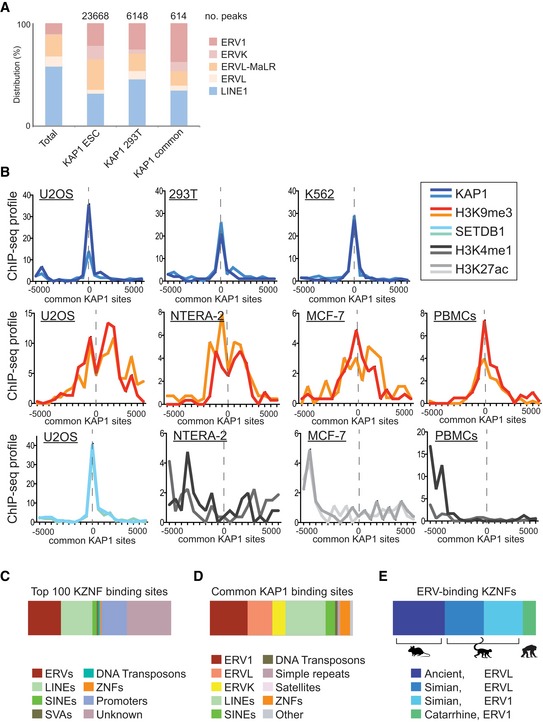
- Comparison of the distribution of KAP1‐bound ERVs and LINE1 elements between undifferentiated cells (human ESCs), differentiated cells (293Ts), and KAP1 common sites (sites conserved between human ESCs and 293T cells). Here, all genomic ERVs or LINE1s were intersected with the stated KAP1 peaks. Total number of intersections (15,399 for KAP1 ESC, 2,519 for KAP1 293T, and 742 for KAP1 common) is different to the total number of KAP1 peaks per dataset (shown) because some peaks intersect multiple or no repeats. For more information on the identity of each common KAP1 peak, see Dataset EV3.
- Complete data of which some is shown in Fig 2F: Genomic coordinates of the common KAP1 sites identified in Fig EV2D were subjected to ChIP‐seq correlation analyses using ChIP‐Cor software (see Materials and Methods). Each plot shows duplicate ChIP‐seq experiments from ENCODE.
- The binding sites (where known 14, 16) within repeats and genes of the top 100 most highly expressed (defined by RNA‐seq RPKM) KZNFs in 293T cells. These KZNFs were also confirmed to be expressed at the protein level (http://www.proteinatlas.org/cell).
- The binding sites within repeats and genes of KAP1 at common KAP1 sites.
- KZNFs within the top 100 most highly expressed group that are known to bind ERVs were assessed for their age and type of ERV that they bind to.